Application Insights
What it is
Application Insights is Azure Monitor’s application-performance-monitoring feature. It collects evidence from inside a running application—requests, dependencies, exceptions, traces, and selected user interactions—so a team can understand what customers experienced rather than only what a server did.
Why it exists
Infrastructure monitoring (CPU, disk) tells you the host is fine but not why users are frustrated. Application Insights instruments the app itself to reveal request latency, error rates, failed dependencies (DBs, external APIs), and end-to-end distributed traces — the insight you need for debugging performance.
Key ideas
- Instrumentation sends application telemetry to Application Insights. For many code-based server applications, Microsoft recommends OpenTelemetry-based collection; the exact setup depends on the runtime.
- A request is work the application receives. A dependency is an external call it makes, such as to storage or a database. An exception records an error. A trace supplies diagnostic context across those operations.
- Application Map and transaction views can show how components call each other. Log Analytics and KQL support deeper analysis where configured.
- Availability tests check an endpoint from outside the application. They are useful evidence of reachability, but do not prove every user journey or dependency works.
Northwind example
When a shopper cannot submit an order, Northwind looks in Application Insights. It can see the failed checkout request, the slow call to Blob Storage, the exception message, and correlated telemetry from the same transaction. A VM CPU metric alone could show that the VM was healthy while customers still saw an application error.
Common confusion
- Application Insights is not a substitute for Azure Monitor infrastructure monitoring; it is part of that wider platform.
- Instrumentation can collect sensitive information if configured carelessly. Choose what to collect, scrub sensitive fields, limit access, and set appropriate retention.
- A successful availability test does not prove a logged-in checkout, payment, or data path is working.
How it fits (diagram)
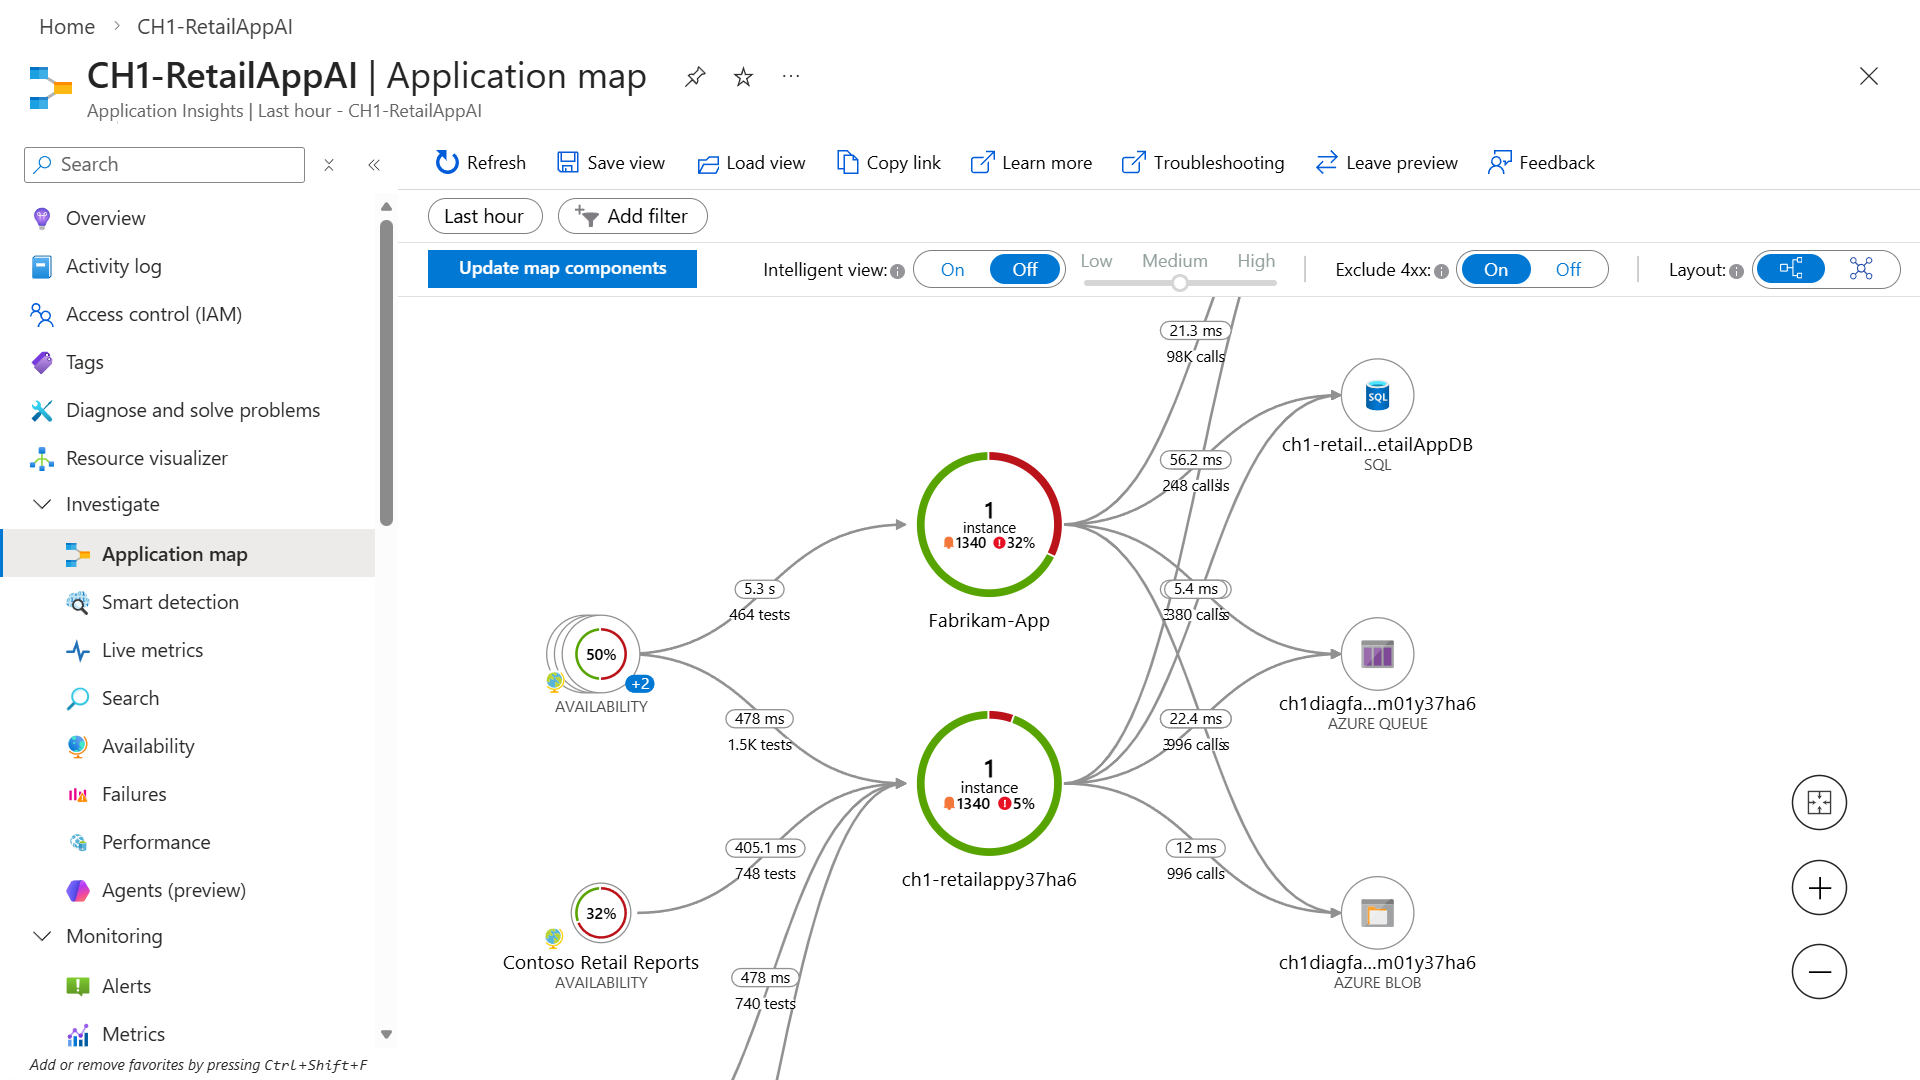
Diagrams courtesy of Microsoft Learn / Azure docs: azure-monitor/app/app-insights-overview
Where it appears in the route
Read azure-monitor first, then connect this entry to log-analytics, kql, alerts, and an application deployment.
Related
azure-monitor · log-analytics · kql · metric-alert · workbooks · northwind-traders-case-study
📘 Source: Microsoft Learn — Application Insights OpenTelemetry observability, checked 2026-09-16.