Metric Alerts
What it is
A metric alert is an Azure Monitor alert rule that evaluates a numeric time-series metric at regular intervals. It fires when its configured condition is met—for example, “CPU percentage exceeds 90% for ten minutes”—and can trigger an action group.
Why it exists
Teams cannot watch dashboards constantly. A metric alert detects a chosen numeric symptom and initiates a response. Its useful speed and cost depend on the metric, evaluation frequency, number of monitored time series, and rule design.
Key ideas
- Components: resource(s) to monitor + signal (metric) + condition & threshold + frequency of evaluation + action group + severity.
- Dynamic thresholds can adapt to an observed baseline; static thresholds suit a clearly defined limit. Both require review so normal bursts do not become alert noise.
- State matters. Metric alerts can be stateful or stateless. A stateful metric alert resolves after the condition fails for the documented consecutive checks; an operator acknowledgement is a separate user response.
- Dimensions can separate cases. A rule can evaluate multiple resources or metric dimensions, which can produce distinct alert instances and affect cost.
- Alert processing rules can add or suppress action groups after an alert fires, for example during a planned maintenance window. The alert itself remains visible.
Northwind example
Northwind monitors request latency for each production order API instance. A metric alert evaluates the latency metric every minute and pages the on-call team only after the threshold holds for the selected window. During planned maintenance, a processing rule suppresses the page but the alert remains available for review. The team compares the alert with logs before deciding whether the cause is traffic, a dependency, or a code change.
How it fits (diagram)
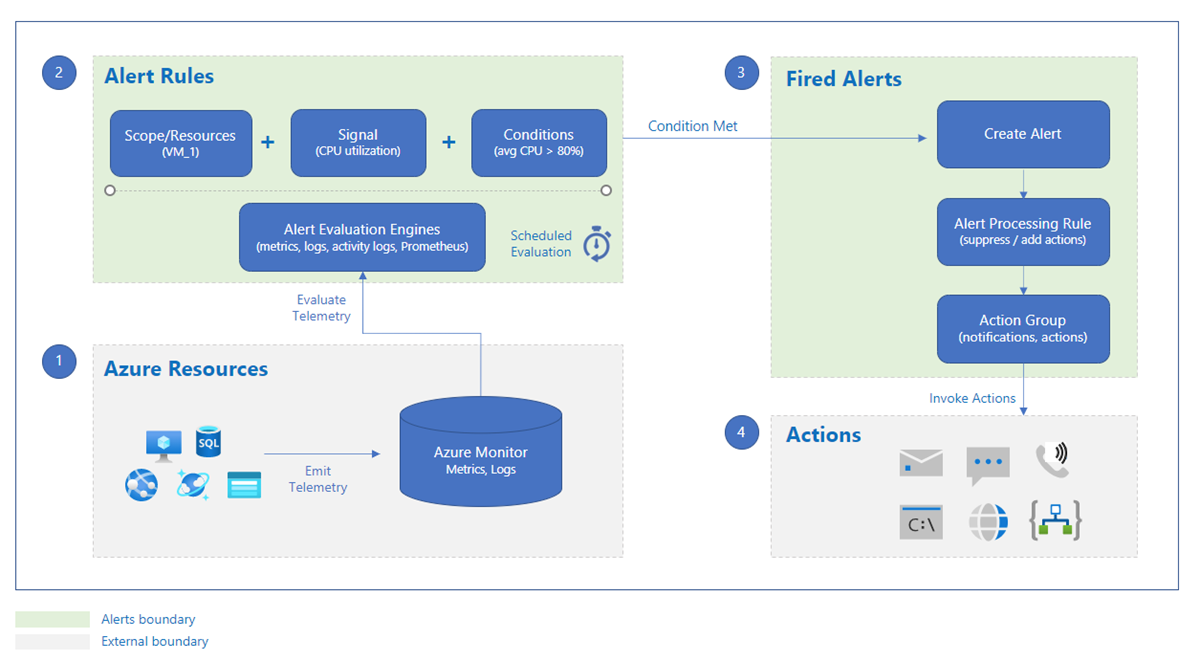
Diagrams courtesy of Microsoft Learn / Azure docs: azure-monitor/alerts/alerts-overview
Exam notes
- Know the four alert signals in Azure Monitor: metric, log (KQL), activity log, resource/availability.
- Threshold + frequency + condition are the configurable core; action group is the notification target.
- Severity, monitor condition, and user response are separate concepts.
- Metric alert type fits numeric time series; use a log or activity-log alert when the evidence is a query result or management event.
- Check the metric source before designing the rule; guest OS signals require the relevant collection configuration.
Related
azure-monitor-metrics · action-group · log-analytics · azure-monitor-activity-log · Home
📘 Source: Microsoft Learn — Metric Alert