Azure Workbooks
What it is
Azure Workbooks are interactive, customizable reports/canvases in Azure Monitor that combine multiple data sources (metrics, Log Analytics KQL queries, activity log, Application Insights) into a single rich document with text, charts, grids, and parameters.
Why it exists
Dashboards show tiles, but incident response needs contextual, parameterized, multi-source views — e.g. “pick an environment then see its VMs, their health, logs, and open alerts together.” Workbooks make that repeatable and shareable, with templates for common scenarios.
Key ideas
- Building blocks: steps combine text, parameters/drop-downs (e.g. select subscription), queries (KQL/metrics), and visualizations (time charts, grids, maps).
- Templates ship for many Azure services (VM, networking, storage) — customize or create from blank.
- Pin workbook parts to dashboards; share across a team/subscription.
- Uses live KQL and metric queries — reusable analysis, not static images.
How it fits (diagram)
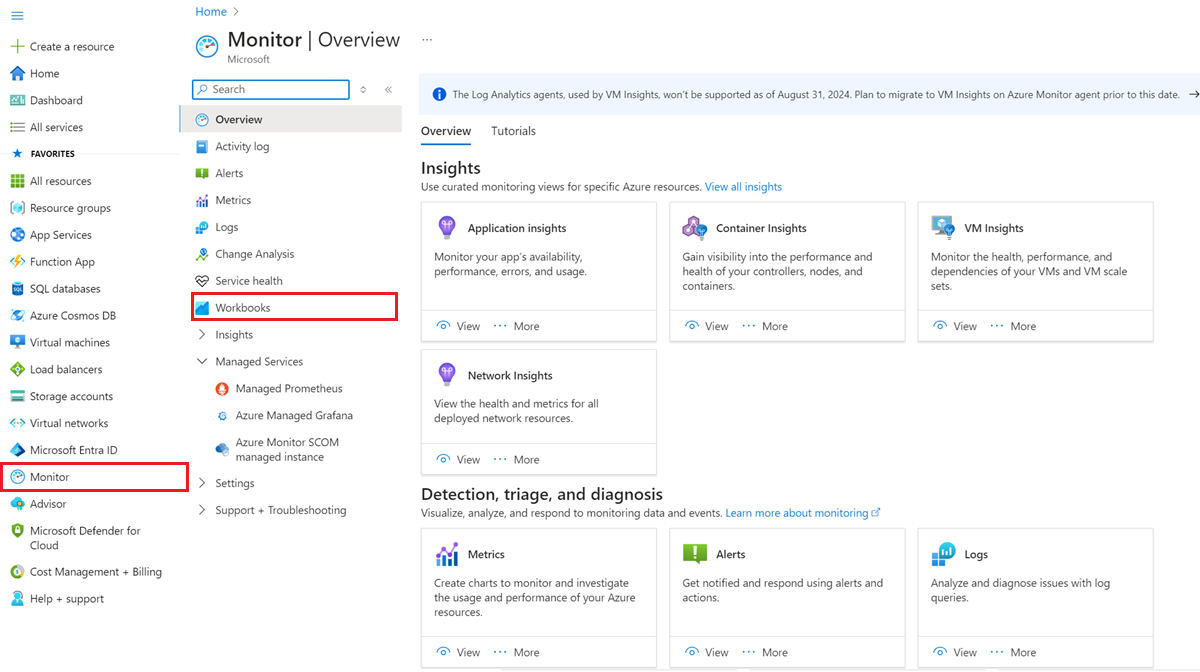
Diagrams courtesy of Microsoft Learn / Azure docs: azure-monitor/visualize/workbooks-overview
Exam notes
- Workbooks = interactive multi-source reports; dashboards = pinned tiles. Don’t confuse the two.
- Strongly tied to KQL and Log Analytics for rich queries.
- Templates and parameters are exam-relevant (“create an interactive monitoring report”).
Related
azure-monitor · log-analytics · kql · azure-monitor-metrics · Home
📘 Source: Microsoft Learn — Workbooks