Log Analytics Workspace
What it is
A Log Analytics workspace is an Azure resource that organizes Azure Monitor log data into tables. It is the place teams commonly send, retain, and query diagnostic and application log records. Log Analytics is also the Azure portal tool used to explore that data in simple mode or with KQL.
Why it exists
Metrics answer a quick numeric question such as “what was CPU at 10:00?” Logs preserve richer event detail: an error message, the affected resource, a request ID, or an audit action. A workspace gives those records a shared, queryable home.
Key ideas
- Tables are structured collections of rows. Examples include
AzureActivity,Heartbeat, and resource- or application-specific tables. The tables present depend on what you collect. - Collection must be configured. A diagnostic setting, data collection rule/agent, or integrated service sends eligible data to the workspace. Creating an empty workspace does not make every Azure log appear there.
- Two ways to explore. Simple mode supports point-and-click filtering, sorting, and aggregation. KQL mode lets you write the full query.
- One workspace can receive data from many resources and subscriptions. Opening Logs from a resource scopes the view to that resource; opening from a workspace can access the workspace’s records.
- Logs can drive action. A saved query can support a log search alert or workbook. Retention and cost must be designed for the data you send.
Northwind example
Northwind sends its order API’s diagnostic logs and selected Azure resource logs to one production workspace. When shoppers report failed orders, Maya opens Logs from the API resource to focus on that application’s records, then uses KQL to group failures by time and error code. A workspace query tells her what happened; a metric chart tells her whether request volume or latency changed at the same time.
How it fits (diagram)
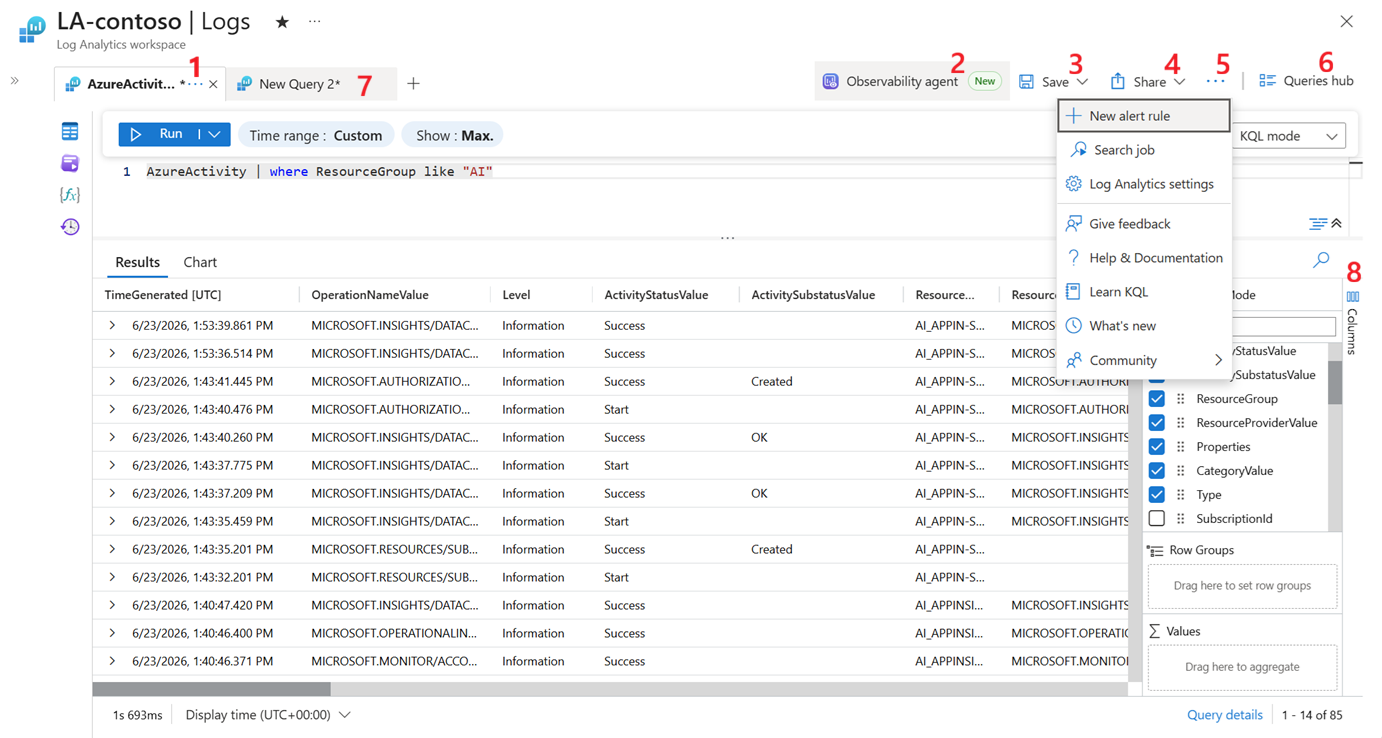
Diagrams courtesy of Microsoft Learn / Azure docs: azure-monitor/logs/log-analytics-overview
Exam notes
- A workspace is a log-data scope; Log Analytics is the query experience.
- Data arrives only through an applicable collection configuration or service integration.
- Log alerts run queries; metric alerts evaluate numeric time-series signals.
Related
kql · azure-monitor · azure-monitor-activity-log · workbooks · metric-alert · Home
📘 Source: Microsoft Learn — Log Analytics