Azure Monitor
What it is
Azure Monitor is Azure’s observability service: it collects and analyzes telemetry, the evidence a system produces about what it is doing. Telemetry can be a number, a log record, an event, or a trace through an application. Azure Monitor helps people see whether a workload is healthy, investigate a problem, and notify or automate a response.
Why it exists
Every resource generates telemetry, but raw data is useless. You need a central place to (1) collect telemetry, (2) store it durably, (3) query/visualize it, and (4) react when something is wrong. Without Azure Monitor you’d have hundreds of disconnected portals per resource.
Key ideas
- Metrics are numeric measurements over time, such as CPU percentage or request count. Use them to spot trends and quick threshold conditions.
- Logs are richer records that you query, commonly in a Log Analytics workspace with KQL. Use them to investigate “which request failed and why?”
- The Activity log records Azure management events, such as someone creating or deleting a resource. It is not the same as an application’s request log.
- Application Insights adds application-level telemetry such as requests, dependencies, exceptions, and traces.
- An alert evaluates a signal and can invoke an action group to notify people or trigger a workflow. A dashboard or workbook helps people explore the data; it does not fix the issue itself.
Northwind example
Northwind uses Azure Monitor to watch its ordering workload. A metric shows that front-end CPU is rising, Application Insights shows that checkout requests are failing after a storage dependency call, and the Activity log shows a network-rule change shortly before the failures. An alert sends the on-call team a notification through an action group. The metric tells Northwind that something changed; the logs and traces help it discover why.
Common confusion
- Azure Monitor is the umbrella service, not a single log file or dashboard.
- Collecting data is not the same as retaining it forever. Configure data collection, destination, retention, access, and cost intentionally.
- An alert is a detector. An action group is the recipient or automation it invokes. Neither replaces an incident-response plan.
How it fits (diagram)
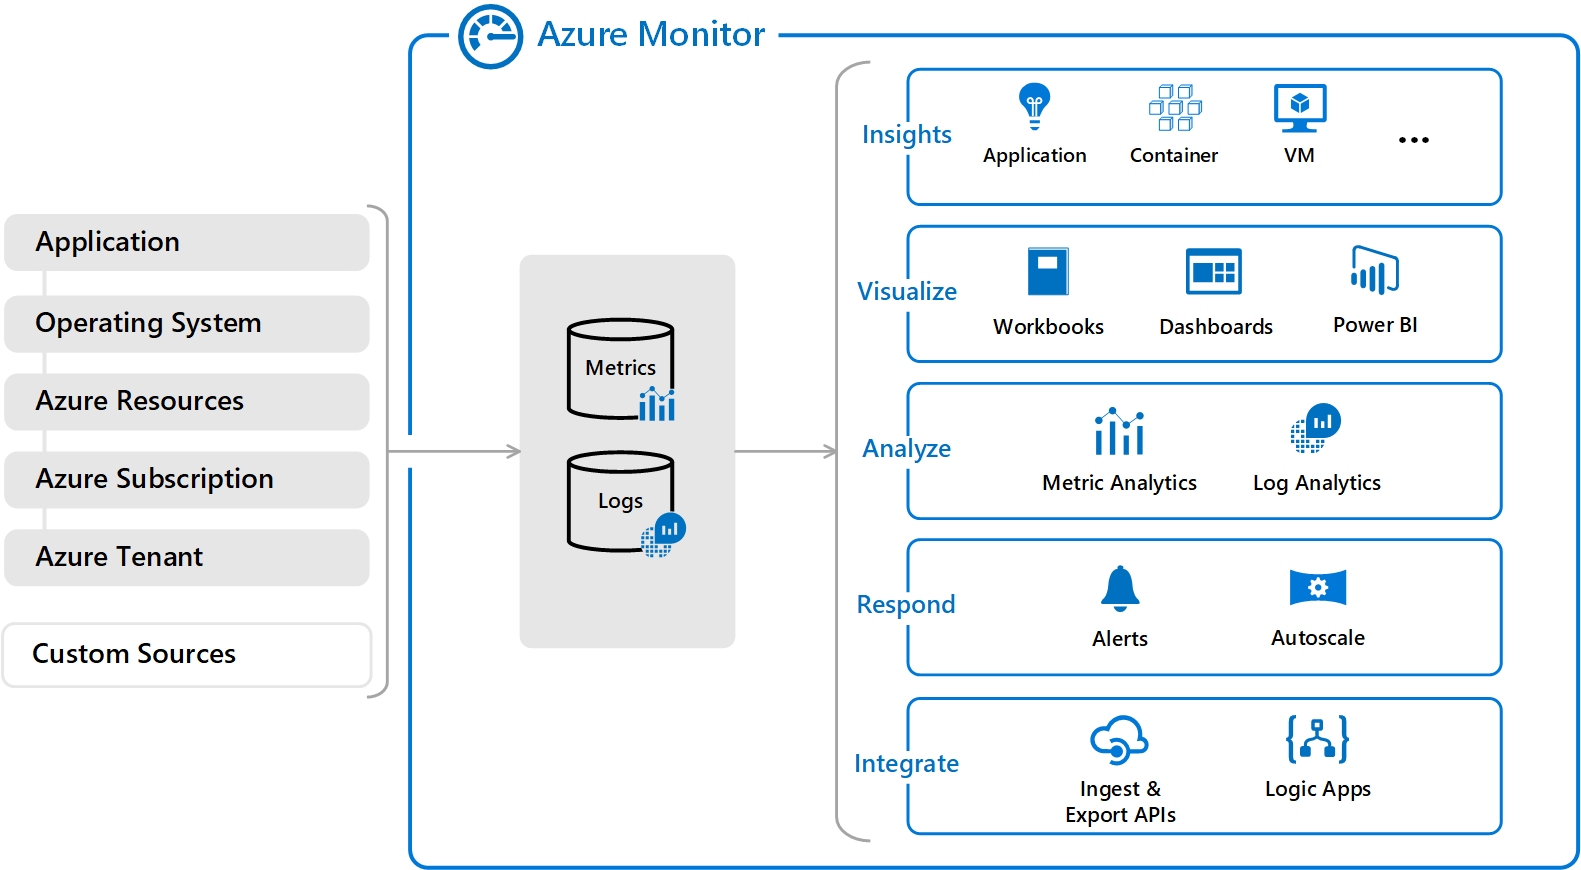
Diagrams courtesy of Microsoft Learn / Azure docs: azure-monitor/overview
Start small
Begin with the user-facing success signal, a few resource-health metrics, a destination for useful logs, and an alert that reaches a real owner. Test the alert and its action before relying on it in an incident. Add more telemetry only when it answers a decision or troubleshooting question.
Related
azure-monitor-metrics · azure-monitor-activity-log · log-analytics · kql · metric-alert · action-group · workbooks · application-insights · northwind-traders-case-study
📘 Source: Microsoft Learn — Azure Monitor overview, checked 2026-09-16.