Azure Monitor Metrics
What it is
Azure Monitor metrics are lightweight, numeric, time-series values that describe how a resource is performing — e.g. CPU percentage, disk I/O, network bytes in/out. They are stored in a time-series database optimized for fast, sub-minute polling and near-real-time alerting.
Why it exists
Some signals are quantitative and time-based: you want to know the value at a moment and its trend over minutes, hours, or days. Metrics give a fast signal for charts and alerts; logs preserve richer event detail and use different ingestion, retention, and query billing.
Key ideas
- Platform metrics are emitted by Azure services without an agent (for example, VM host CPU and storage-account requests). Standard collected platform metrics have no direct charge, but alerts, REST API retrieval, exported data, custom metrics, and related logs can have charges.
- Guest OS metrics (inside a VM: processes, guest CPU/memory) require the Azure Monitor Agent (Azure Monitor agent).
- Custom metrics can be pushed/injected by your apps or via the metrics API.
- Platform and custom metrics are retained for 93 days. A Metrics Explorer chart can query up to 30 days at once; use an appropriate time range or another destination for longer analysis.
- Viewed as charts in metrics explorer, pinned to dashboards, or queried for metric alerts.
How it fits (diagram)
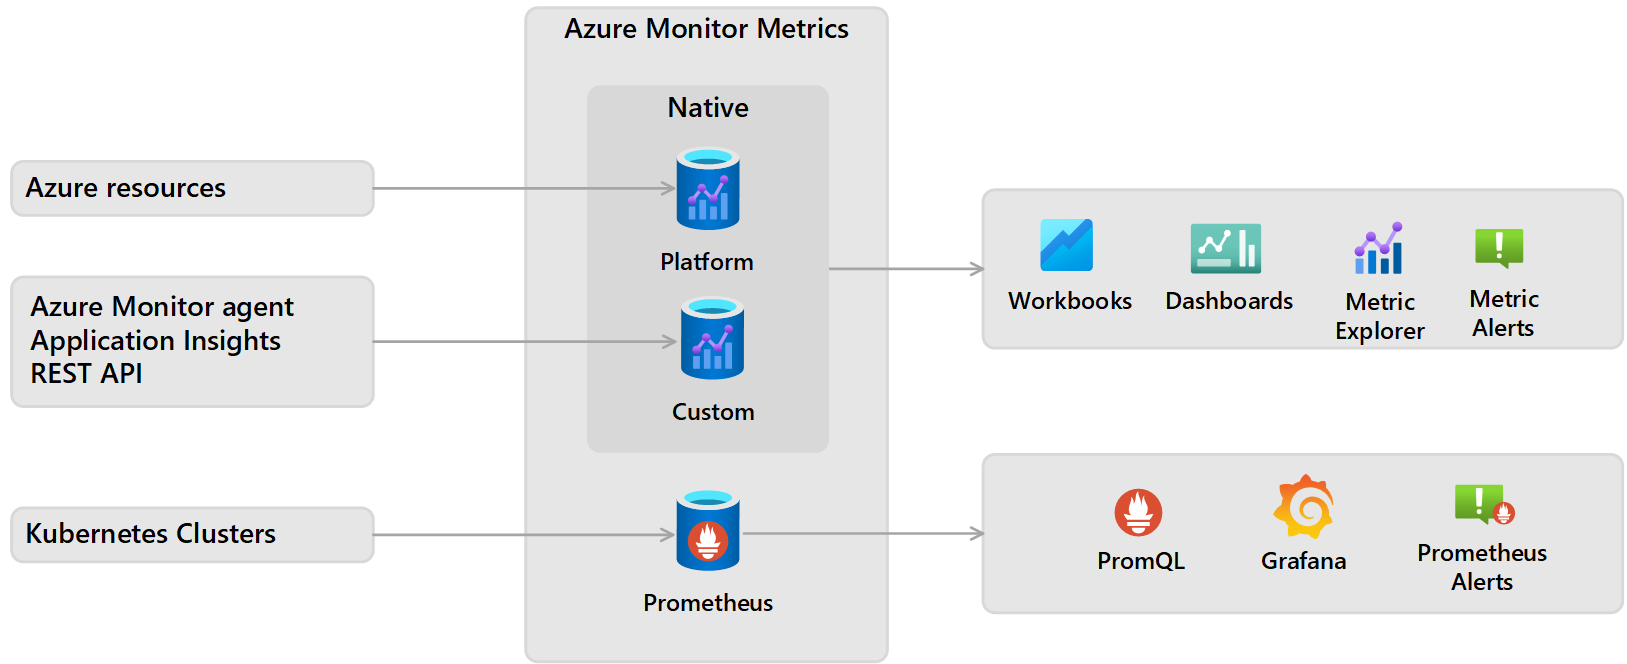
Diagrams courtesy of Microsoft Learn / Azure docs: azure-monitor/essentials/data-platform-metrics
Exam notes
- Platform metrics need no agent, and standard collection has no direct charge. Budget separately for alert rules, logs, custom metrics, API retrieval, and data export.
- To see in-VM (guest) performance metrics you must install the Azure Monitor Agent + enable diagnostics.
- Metric alerts are the fastest reacting alert type — good for “CPU > 90% for 10 min.”
- Don’t confuse metric alerts (metric signal) with log/log-analytics alerts (KQL query signal) or activity-log alerts.
Related
azure-monitor · metric-alert · log-analytics · workbooks · Home
📘 Source: Microsoft Learn — Metrics in Azure Monitor and Azure Monitor cost and usage, checked 2026-08-22. Re-audit when metrics retention, retrieval, alerting, or pricing behavior changes.