AZ-400 Implement Continuous Feedback
The loop: read production, feed back into planning
Implement Continuous Feedback — MOC
MS Learn path: Implement continuous feedback · The loop closes: learn from production, feed back into planning.
Map / Canvas
The core idea
The release doesn’t end at deployment — it starts the observe → learn → plan cycle. Feedback is collected continuously from production and feeds the next iteration:
- Collect telemetry → Azure Monitor (infrastructure) + Application Insights (application).
- Understand users → user analytics (behavior) + feature usage (adoption).
- Detect problems proactively → synthetic testing (availability) + alerting (notifications).
- Act → insights become backlog/work items, closing the feedback loop of continuous feedback.
Modules in this path
- Introduction to continuous feedback
- Telemetry and monitoring (Azure Monitor & App Insights)
- Usage analytics: user behavior
- Synthetic testing and alerting
Concepts (linked from here)
continuous-feedback · feedback-loop · telemetry · Azure Monitor · Application Insights · user-analytics · feature-usage · synthetic-testing · alerting
Skills measured (exam blueprint)
- Design and configure monitoring for applications and infrastructure (Azure Monitor, Application Insights).
- Implement continuous feedback by using telemetry, user/usage analytics, and availability (synthetic) tests.
- Turn insights into actionable alerts and feed findings back into planning → release improvement.
Practice
⚠ verify — add practice questions on Azure Monitor vs App Insights telemetry, SDK instrumentation, availability-test types (ping/standard/multi-step), and alert rule → action group anatomy.
Practice questions
- az400-q-feedback-001 — Application Insights synthetic (availability) tests
Introduction to Continuous Feedback
Overview
Why “implement continuous feedback” is a core loop in the DevOps lifecycle. Releases don’t end when code ships — they start the observe → learn → plan cycle that makes the next release better.
Units
- Why continuous feedback matters
- What feedback is collected and acted on
- The tools that enable the loop
- How feedback feeds planning and delivery
Concepts introduced
- continuous-feedback — the practice of collecting and acting on production signals.
- feedback-loop — the cycle that turns data into the next planned work.
- telemetry — the raw signals (metrics, logs, traces) feeding the loop.
- azure-monitor and application-insights ground the loop in real Azure tooling.
Key terms & commands
- Monitoring vs feedback — monitoring observes; feedback changes what you build next.
- Tools map: Azure Monitor (infrastructure), Application Insights (application), Azure Boards (work items from insights).
Hands-on
- Identify which telemetry (infra vs app) to collect for a sample scenario.
- Sketch a feedback loop: collection → analysis → backlog → delivery.
Exam focus
- Know the two feedback dimensions: application/system and user/behavior.
- Recognize that telemetry/insights must feed the backlog (a loop), not just be displayed.
Related
Telemetry and Monitoring
Overview
Collecting and analyzing telemetry from infrastructure and applications so you can measure performance, availability, and health — the observation half of continuous feedback.
Units
- Instrument applications and infrastructure for telemetry
- Azure Monitor metrics, logs, and activity log
- Application Insights application telemetry & dependencies
- Querying telemetry (KQL) and building workbooks/dashboards
Concepts introduced
- telemetry — metrics, logs, traces, and usage signals.
- Azure Monitor — unified platform for infrastructure telemetry (metrics, logs, activity).
- Application Insights — application/code-level telemetry (requests, dependencies, exceptions, traces).
- Log Analytics — the KQL-queryable store behind logs and App Insights.
- Alerts — turning stored telemetry into proactive notifications.
Key terms & commands
- Three Azure Monitor sinks: Metrics, Activity Log, Log Analytics.
- Instrument the app with the App Insights SDK to collect request/dependency/exception telemetry.
- Query telemetry with KQL into workbooks and dashboards.
Hands-on
- Add Application Insights to an app and view request/failure telemetry.
- Query App Insights data with KQL and build a workbook.
Exam focus
- Differentiate infrastructure (Azure Monitor) vs application (App Insights) telemetry.
- Know App Insights data lives in a Log Analytics workspace and is KQL-queryable.
Related
telemetry · azure-monitor · application-insights · log-analytics · alerting · Path MOC
Usage Analytics: Understanding User Behavior
Overview
Using application telemetry to understand how real users interact with your product — behavior, feature adoption, and satisfaction — and turning that understanding into product decisions. This is the user side of continuous feedback.
Units
- Collecting user/usage telemetry
- Analyzing page views, sessions, funnels, and engagement
- Measuring feature adoption and drop-off
- Feeding insights into the backlog
Concepts introduced
- user-analytics — behavioral insights (page views, sessions, funnels, retention).
- feature-usage — which features are adopted/used (product-adoption lens).
- Application Insights — the instrumentation source for user telemetry.
- feedback-loop — how usage insights become planned work.
Key terms & commands
- Track custom events (e.g. “feature used”) in App Insights for adoption measurement.
- Pair adoption telemetry with feature flags: ship to a subset, measure, then roll out or kill.
- Analyze usage via KQL over App Insights data.
Hands-on
- Instrument custom events and build a usage/funnel query.
- Use feature-usage data to make a “keep / expose / retire” decision.
Exam focus
- User analytics = how users behave; feature usage = which features get used.
- Usage telemetry is only valuable when it feeds planning (the feedback loop).
Related
user-analytics · feature-usage · application-insights · feedback-loop · Path MOC
Reliability: Synthetic Testing and Alerting
Overview
Proactively verifying availability and turning telemetry into actionable notifications — the detection half of continuous feedback that surfaces problems before (or as soon as) they impact users.
Units
- Validating application availability with synthetic tests
- Configuring Azure Monitor alert rules and action groups
- Severity, dynamic thresholds, and anomaly detection
- Responding to alerts and feeding findings back
Concepts introduced
- synthetic-testing — proactive, scripted availability checks from global locations.
- alerting — rule = signal + condition + action group.
- Application Insights — availability/availability tests (URL ping, standard, multi-step).
- Azure Monitor — alert rules and action groups based notifications.
Key terms & commands
- Availability tests in App Insights: URL ping (basic), standard (request + dependency), multi-step (recorded journey).
- An alert rule combines a signal (metric/log/availability) with a condition, and fires an action group (email, SMS, webhook/ITSM).
- Tests run from multiple global locations on a schedule.
Hands-on
- Create an App Insights availability (URL ping) test and an alert on failure.
- Define an alert rule + action group for a metric threshold.
Exam focus
- Synthetic = proactive availability (“is it up?”), telemetry = reactive/real-user.
- Know the alert anatomy: rule → signal + condition → action group.
- Availability-test failure is a common alert source.
Related
synthetic-testing · alerting · application-insights · azure-monitor · Path MOC
Core / Loop
Continuous Feedback
What it is
Continuous feedback is the practice of continuously collecting, analyzing, and acting on signals about how a system and its users behave in production, then feeding what you learn back into planning and development. It is one of the core DevOps practices that closes the loop between shipping software and understanding whether that software actually delivers value.
Why it exists
A deployment is not the end of the cycle — it is the start of the next one. Continuous feedback exists so teams:
- Learn from real users and real production data, not assumptions.
- Detect problems, regressions, and unmet needs early.
- Turn monitoring/telemetry into priorities and work items for the next iteration.
It directly powers continuous improvement: release → observe → learn → plan → release again.
Key ideas
- Feedback is two-sided: application/system feedback (performance, errors, availability) and user feedback (usage, satisfaction, feature adoption).
- It pairs automated telemetry (telemetry, Azure Monitor, Application Insights, synthetic-testing) with human signals (surveys, NPS, support tickets, work item feedback).
- Great feedback is actionable — raw data is not feedback until it changes what you build next (feeds a feedback-loop).
- Funnel ideas into a backlog / work items so insights become features, fixes, or rollbacks.
Exam notes
- AZ-400 treats “implement continuous feedback” as a distinct path: collect and use feedback to prioritize and improve releases.
- Know the tools in the feedback toolkit: Azure Monitor (infrastructure), Application Insights (application), Azure Monitor logs/metrics, and Azure Boards (acting on feedback as work items).
- The exam emphasizes the loop: monitoring data and user insights must feed back into planning/delivery, not just be displayed.
Related
feedback-loop · telemetry · azure-monitor · application-insights · user-analytics · feature-usage · alerting · synthetic-testing
📘 Source: Microsoft Learn — Continuous Feedback
Feedback Loop
What it is
A feedback loop is the structured cycle in which signals about a deployed system and its users are collected, analyzed, prioritized, and turned into the next planned work — so each release makes the product measurably better. It is the mechanism that operationalizes continuous feedback.
Why it exists
Insights that never change what you build are worthless. The feedback loop exists to make improvement systematic and continuous: rather than shipping and hoping, teams institutionalize “observe → learn → act → re-observe” so quality and value ratchet upward release over release.
Key ideas
- Close the loop:
- Collect — telemetry, App Insights, alerts, user analytics, surveys/NPS, tickets.
- Analyze — query logs (KQL), review dashboards/workbooks, triage bugs & enhancement requests.
- Prioritize — turn insights into PBI/bug/feature work items in a backlog.
- Deliver — plan the work into the next iteration; re-observe the impact.
- A short loop (e.g. fast dashboard/alerts) enables rapid detection; a planning loop (backlog → release) applies learnings at scale.
- Feedback quality matters as much as volume — the loop filters noise into actionable decisions.
Exam notes
- The feedback loop is the why behind every “implement continuous feedback” tool you learn (Monitor, App Insights, Boards).
- Know the pattern: data → insight → backlog item → release → re-measure.
- The exam asks how tools connect — e.g. App Insights data becomes a work item in Azure Boards to fix or enhance.
Related
continuous-feedback · telemetry · user-analytics · feature-usage · alerting · synthetic-testing
📘 Source: Microsoft Learn — Feedback Loop
Telemetry
What it is
Telemetry is the data that a system automatically generates about its own operation — metrics, logs, events, traces, and usage signals — that is collected for monitoring, analysis, and diagnosis. It is the raw material of continuous feedback and observability.
Why it exists
Systems are too complex to debug by guessing. Telemetry gives you an observable system: instead of wondering why a service is slow or failing, you collect structured data from it so you can measure, query, alert, and diagnose from real evidence.
Key ideas
- Kinds of telemetry:
- Two planes in Azure: infrastructure/platform telemetry via Azure Monitor; application telemetry via Application Insights.
- Telemetry must be instrumented (app code, SDK, or built-in source), collected, stored, and acted on to be useful.
Exam notes
- Remember the telemetry sinks in Azure Monitor: Metrics, Activity Log, and Log Analytics (logs) — each holds a different kind of data.
- Differentiate infrastructure telemetry (Azure Monitor) from application telemetry (Application Insights).
- Telemetry is only valuable when it feeds alerts, dashboards, or a feedback loop — not when it just sits in a store.
- Know that Application Insights data is stored in a Log Analytics workspace and is KQL-queryable.
Related
continuous-feedback · azure-monitor · application-insights · azure-monitor-metrics · log-analytics · alerting · feedback-loop
📘 Source: Microsoft Learn — Telemetry
Azure Tooling
Azure Monitor
What it is
Azure Monitor is the unified monitoring platform for all Azure (and some on-premises/other-cloud) resources. It collects, analyzes, and acts on telemetry — the data a resource emits — and turns it into insights, dashboards, alerts, and automation. It is the single pane of glass for “what is happening in my environment.”
Why it exists
Every resource generates telemetry, but raw data is useless. You need a central place to (1) collect telemetry, (2) store it durably, (3) query/visualize it, and (4) react when something is wrong. Without Azure Monitor you’d have hundreds of disconnected portals per resource.
Key ideas
- Two telemetry “pipelines”: time-series metrics and Log Analytics logs (KQL-queryable via KQL).
- Sources: platform telemetry generated by Azure, guest OS/VM diagnostics, application telemetry (via Application Insights), and custom metrics/logs.
- Data stores: Metrics store (retention ~93 days / 30 days default) + Log Analytics workspace (configurable retention).
- Act & react: alerts fire on signals and trigger action groups; data can feed workbooks/dashboards.
- Activity log (control-plane audit) is a separate log stream of management events.
How it fits (diagram)
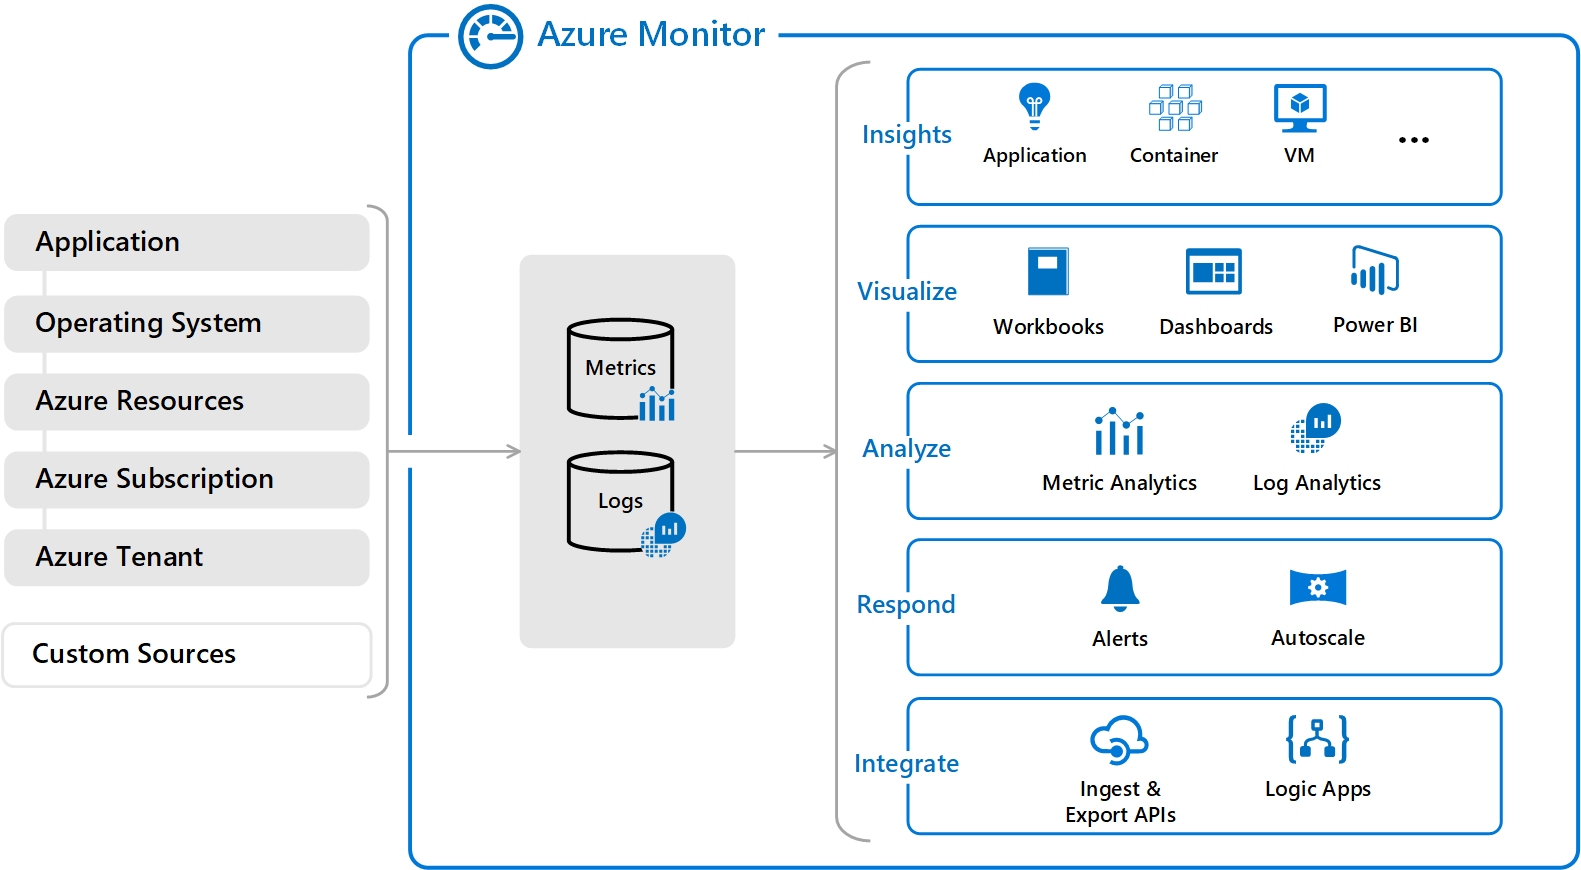
Diagrams courtesy of Microsoft Learn / Azure docs: azure-monitor/overview
Exam notes
- Know the three telemetry sinks: Metrics, Activity Log, Log Analytics — and what each holds.
- Metrics = numeric, time-series, granular performance. Activity log = control-plane/audit events (
who did what). Logs = diagnostic text/data queried with KQL. - Azure Monitor is the umbrella under which metrics, logs, alerts, and Application Insights live — many exam questions test “which tool for which job.”
Related
azure-monitor-metrics · azure-monitor-activity-log · log-analytics · kql · metric-alert · action-group · workbooks · application-insights · Home
📘 Source: Microsoft Learn — Azure Monitor
Application Insights
What it is
Application Insights is an Application Performance Monitoring (APM) feature of Azure Monitor that collects application-level telemetry — requests, dependencies, exceptions, page views, traces — from live apps (web apps, functions, APIs, mobile). It’s the application observability layer, complementing platform infrastructure metrics.
Why it exists
Infrastructure monitoring (CPU, disk) tells you the host is fine but not why users are frustrated. Application Insights instruments the app itself to reveal request latency, error rates, failed dependencies (DBs, external APIs), and end-to-end distributed traces — the insight you need for debugging performance.
Key ideas
- Instrument apps with the SDK (or agentless for certain PaaS) sending telemetry to an Application Insights workspace (backed by Log Analytics).
- Signals: requests, dependencies, exceptions, traces, metrics, availability tests (URL ping from global locations).
- Rich views: Application Map (visual service dependencies), Live Metrics, Profiler/Snapshot Debugger (paid).
- Data stored in a Log Analytics workspace — query with KQL, feed workbooks and alerts.
- Availability / URL ping tests are a key monitoring feature.
How it fits (diagram)
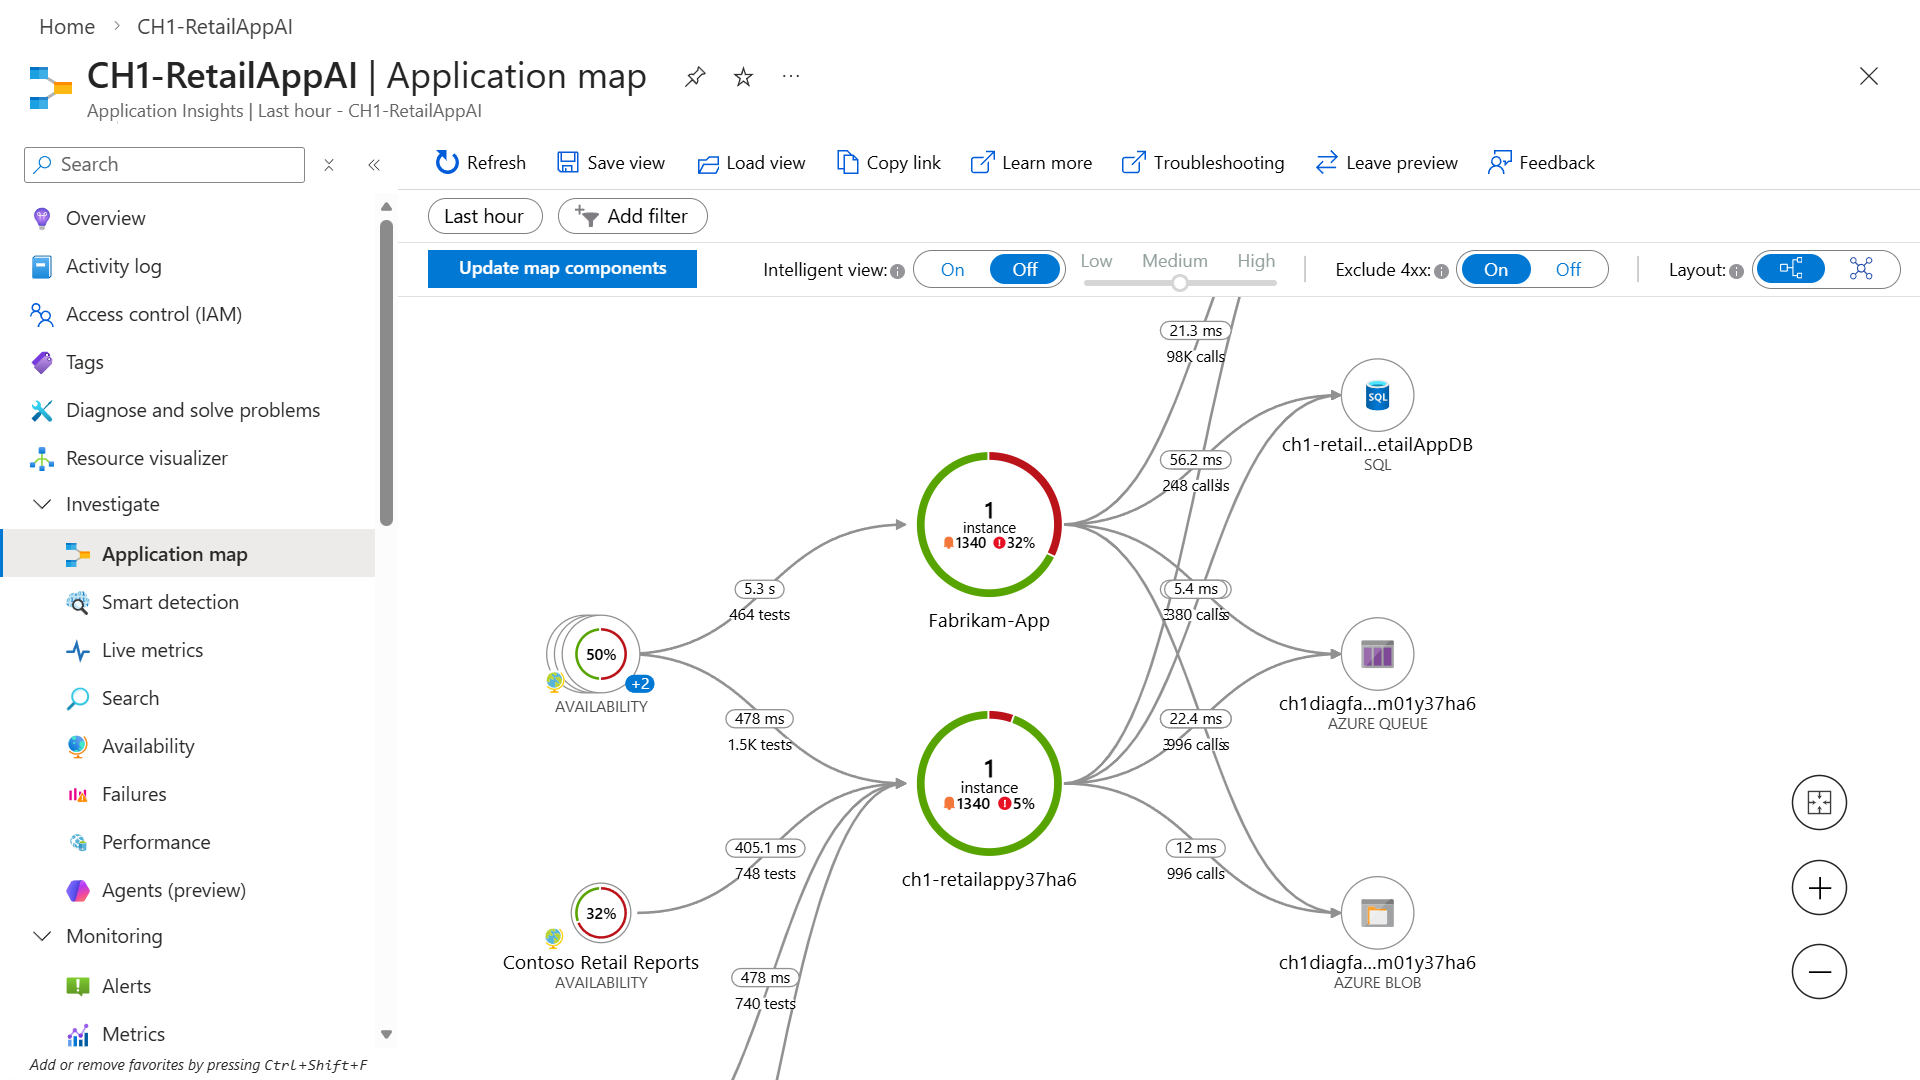
Diagrams courtesy of Microsoft Learn / Azure docs: azure-monitor/app/app-insights-overview
Exam notes
- App Insights = application (code) telemetry; Azure Monitor metrics/logs = infrastructure/platform telemetry.
- Data lives in a Log Analytics workspace and is KQL-queryable.
- Availability tests (ping from global locations) check a URL’s reachability — often a question topic.
- Instrument the app, not just the host.
Related
azure-monitor · log-analytics · kql · metric-alert · workbooks · Home
📘 Source: Microsoft Learn — Application Insights
User & Reliability Signals
User Analytics
What it is
User analytics is the collection and analysis of how real users interact with an application — page views, sessions, funnels, retention, clicks, geography, device, and journey paths — to understand behavior and satisfaction. In an Azure context it is typically instrumented through Application Insights and powered by its telemetry + KQL queries.
Why it exists
Performance monitors tell you a server is healthy, but user analytics tells you whether people actually use and value the product. It exists to answer “are users getting value?” — which is the insight that drives product decisions and ties back into continuous feedback.
Key ideas
- Signals tracked: page views, sessions, users, click/feature events, funnel steps (where users drop off), retention over time, geo/device breakdown.
- Where it lives: App Insights Browser/usage telemetry and custom events, queried with KQL over the Log Analytics store.
- Workbooks/views: usage analytics render as funnels, cohorts, and date-range comparisons (not just raw KQL).
- User analytics answers behavioral questions (“what do users do?”) while feature usage answers product-adoption questions (“which features get used?”).
Exam notes
- Pair user analytics (behavior) with feature usage (adoption) — the exam treats both as the user side of continuous feedback.
- Know it’s instrumented via Application Insights and analyzed with KQL.
- The point of collecting it is to feed back into the backlog/planning (a feedback-loop), not just to display dashboards.
Related
application-insights · feature-usage · feedback-loop · continuous-feedback · telemetry
📘 Source: Microsoft Learn — User Analytics
Feature Usage
What it is
Feature usage is telemetry about how much and how often specific features or product areas of an application are used — tracking adoption, popularity, and drop-off of individual features so teams know what to keep, improve, or retire.
Why it exists
Not every feature ships to an audience. Feature usage exists to answer “do users actually use what we built?” It surfaces low-adoption or unused features, reveals which areas deserve investment, and validates whether a release achieved its intended outcome — closing the feedback loop.
Key ideas
- Tracked via custom events in Application Insights / telemetry (e.g. “button clicked”, “workflow completed”), or explicit feature-instrumentation flags.
- Pair with feature flags: ship a feature dark, measure usage, then roll it out fully or kill it based on adoption.
- Metrics of interest: active users per feature, usage frequency, conversion/drop-off within a feature.
- It is the product/adoption lens, complementary to user analytics (overall behavior).
Exam notes
- Feature usage is the “are features used?” signal that feeds decisions to keep / expose / retire functionality.
- Often tested together with feature flags as a way to release to a subset and measure adoption before full rollout.
- Instrument custom events in App Insights and query adoption with KQL into workbooks.
Related
application-insights · user-analytics · feature-flags · feedback-loop · continuous-feedback
📘 Source: Microsoft Learn — Feature Usage
Synthetic Testing
What it is
Synthetic testing (synthetic/active monitoring) is a technique that continuously generates scripted, simulated user traffic against a live application from external locations to verify availability, responsiveness, and key flows — even when no real users are online. In Azure it’s delivered by Application Insights availability tests (URL ping, multi-step, and standard tests).
Why it exists
Passive telemetry only tells you about real users’ traffic — if nobody is online during an outage, you won’t know until users complain. Synthetic testing exists to proactively verify the app is up and responding before users are impacted, by simulating requests from fixed global points on a schedule.
Key ideas
- Run tests from multiple global locations on a schedule (e.g. every 5 minutes) against URLs or multi-step flows.
- Availability tests in Application Insights: URL ping, standard test (combines request + dependency validation), and multi-step web test (a recorded user journey).
- Each test reports success/failure, response time, and location breakdown; failures can fire alerts via action groups.
- Complements passive monitoring: synthetic = proactive, telemetry = reactive/real-user.
Exam notes
- Synthetic testing = proactive availability monitoring; App Insights availability tests are the Azure implementation.
- Remember the three test kinds: URL ping (basic), standard (request + dependencies), multi-step (browser journey).
- Tests run from global locations → catches regional issues; successful results prove an endpoint is reachable and responsive, not that the app is bug-free.
- Commonly feeds status dashboards and alerts (the “is it up?” signal in the feedback loop).
Related
application-insights · azure-monitor · alerting · continuous-feedback · feedback-loop
📘 Source: Microsoft Learn — Synthetic Testing
Alerting
What it is
Alerting is the practice of proactively notifying the right people when monitored telemetry crosses a defined threshold or condition, so issues are surfaced and acted on without someone watching a dashboard. In Azure it is built on Azure Monitor alerts — rules that evaluate signals and trigger an action group (email, SMS, webhook, ITSM, VM, etc.).
Why it exists
Telemetry sitting in a store is passive — a problem only surfaces when someone happens to look. Alerting exists to make monitoring event-driven: the system actively tells you “this is broken / degrading” so you can respond quickly, minimizing outages and user impact.
Key ideas
- An alert rule = signal + condition + action:
- Signal — metric (metric alert), log query (KQL), activity-log event, or App Insights condition.
- Condition/logic — e.g. CPU > 85%, error count > 5, URL unavailable.
- Action group — who/how to notify (email, SMS, push, webhook/automation, ITSM).
- Alerts have severity levels and can include dynamic thresholds (anomaly-based) in addition to static thresholds.
- Managed alerts keep you proactive: they’re the trigger side of a feedback loop.
Exam notes
- Know the alert rule anatomy: rule → signal + condition → action group.
- Metric alert = numeric threshold on a metric; log-alert = condition evaluated against a KQL query result.
- An action group centralizes notification channels and is reused across many alert rules.
- The exam pairs alerts with monitoring: alerts turn raw telemetry into notifications that drive response and the feedback loop.
- Synthetic/availability test failures are a common alert source (App Insights).
Related
azure-monitor · metric-alert · application-insights · action-group · telemetry · synthetic-testing · feedback-loop
📘 Source: Microsoft Learn — Alerting