AZ-104: Monitor & Backup
Azure Monitor
What it is
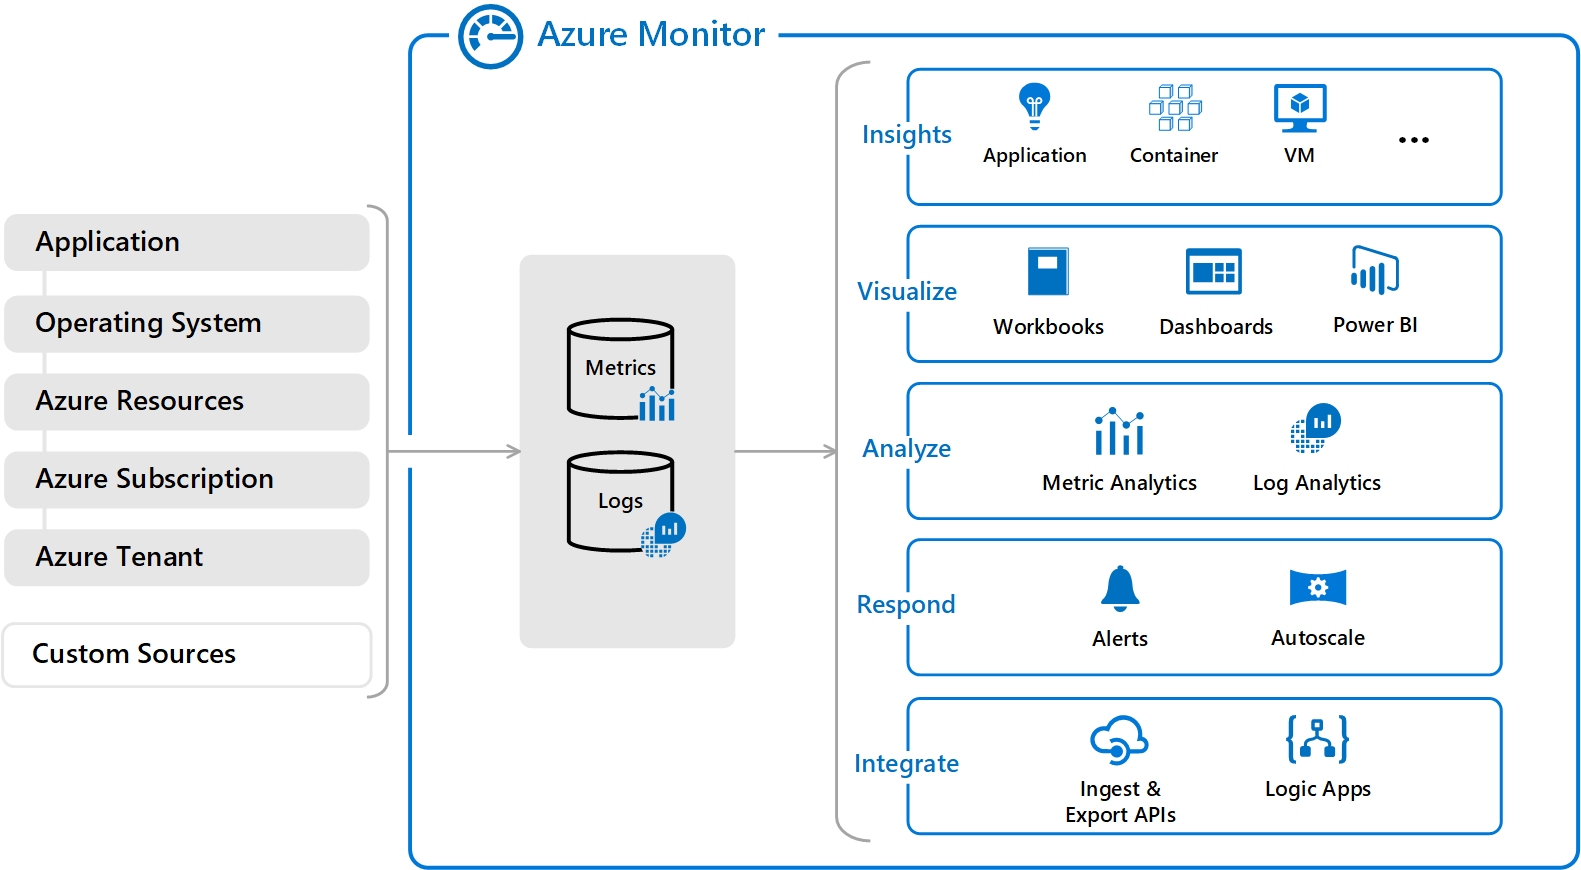
Azure Monitor is Azure’s observability service: it collects and analyzes telemetry, the evidence a system produces about what it is doing. Telemetry can be a number, a log record, an event, or a trace through an application. Azure Monitor helps people see whether a workload is healthy, investigate a problem, and notify or automate a response.
Why it exists
Every resource generates telemetry, but raw data is useless. You need a central place to (1) collect telemetry, (2) store it durably, (3) query/visualize it, and (4) react when something is wrong. Without Azure Monitor you’d have hundreds of disconnected portals per resource.
Key ideas
- Metrics are numeric measurements over time, such as CPU percentage or request count. Use them to spot trends and quick threshold conditions.
- Logs are richer records that you query, commonly in a Log Analytics workspace with KQL. Use them to investigate “which request failed and why?”
- The Activity log records Azure management events, such as someone creating or deleting a resource. It is not the same as an application’s request log.
- Application Insights adds application-level telemetry such as requests, dependencies, exceptions, and traces.
- An alert evaluates a signal and can invoke an action group to notify people or trigger a workflow. A dashboard or workbook helps people explore the data; it does not fix the issue itself.
Northwind example
Northwind uses Azure Monitor to watch its ordering workload. A metric shows that front-end CPU is rising, Application Insights shows that checkout requests are failing after a storage dependency call, and the Activity log shows a network-rule change shortly before the failures. An alert sends the on-call team a notification through an action group. The metric tells Northwind that something changed; the logs and traces help it discover why.
Common confusion
- Azure Monitor is the umbrella service, not a single log file or dashboard.
- Collecting data is not the same as retaining it forever. Configure data collection, destination, retention, access, and cost intentionally.
- An alert is a detector. An action group is the recipient or automation it invokes. Neither replaces an incident-response plan.
How it fits (diagram)
Diagrams courtesy of Microsoft Learn / Azure docs: azure-monitor/overview
Start small
Begin with the user-facing success signal, a few resource-health metrics, a destination for useful logs, and an alert that reaches a real owner. Test the alert and its action before relying on it in an incident. Add more telemetry only when it answers a decision or troubleshooting question.
Related
azure-monitor-metrics · azure-monitor-activity-log · log-analytics · kql · metric-alert · action-group · workbooks · application-insights · northwind-traders-case-study
📘 Source: Microsoft Learn — Azure Monitor overview, checked 2026-09-16.
Azure Monitor Metrics
What it is
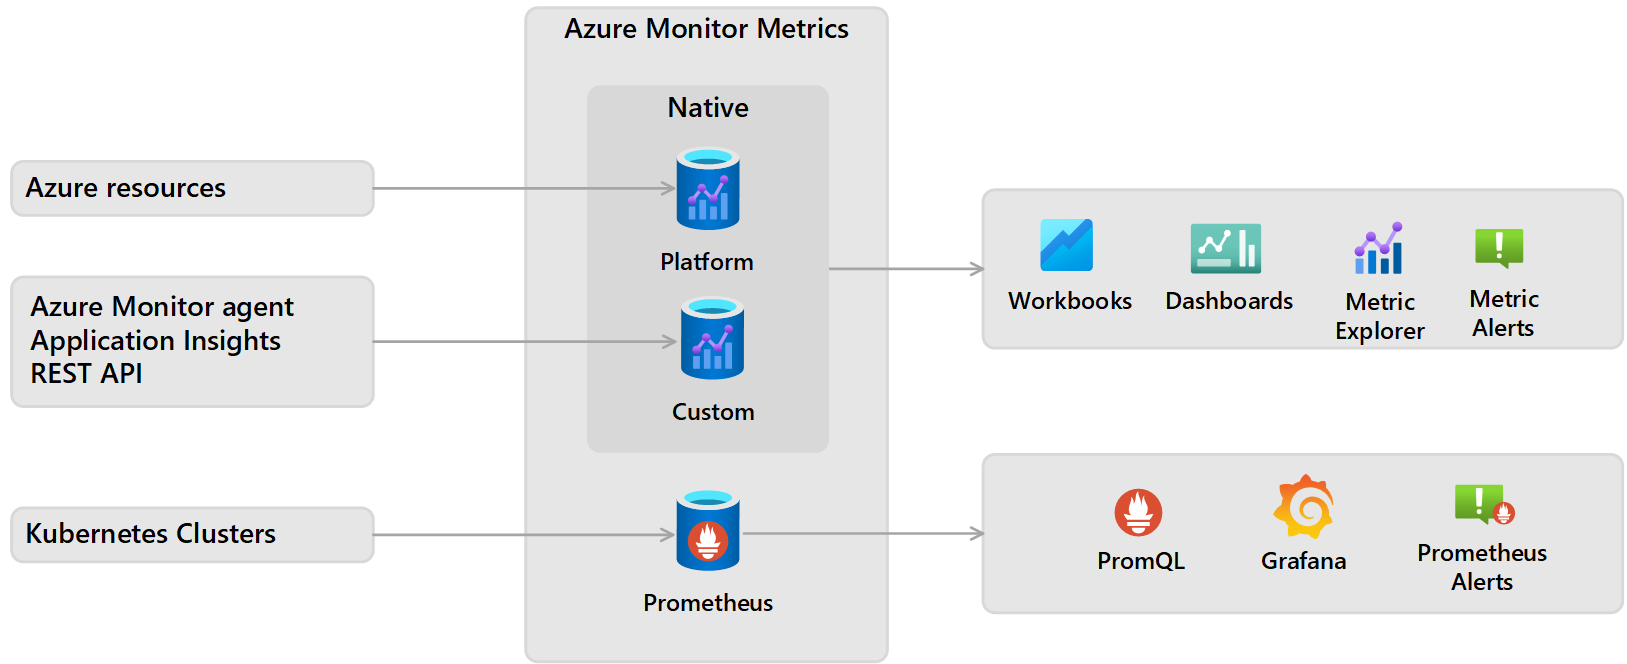
Azure Monitor metrics are lightweight, numeric, time-series values that describe how a resource is performing — e.g. CPU percentage, disk I/O, network bytes in/out. They are stored in a time-series database optimized for fast, sub-minute polling and near-real-time alerting.
Why it exists
Some signals are quantitative and time-based: you want to know the value at a moment and its trend over minutes, hours, or days. Metrics give a fast signal for charts and alerts; logs preserve richer event detail and use different ingestion, retention, and query billing.
Key ideas
- Platform metrics are emitted by Azure services without an agent (for example, VM host CPU and storage-account requests). Standard collected platform metrics have no direct charge, but alerts, REST API retrieval, exported data, custom metrics, and related logs can have charges.
- Guest OS metrics (inside a VM: processes, guest CPU/memory) require the Azure Monitor Agent (Azure Monitor agent).
- Custom metrics can be pushed/injected by your apps or via the metrics API.
- Platform and custom metrics are retained for 93 days. A Metrics Explorer chart can query up to 30 days at once; use an appropriate time range or another destination for longer analysis.
- Viewed as charts in metrics explorer, pinned to dashboards, or queried for metric alerts.
How it fits (diagram)
Diagrams courtesy of Microsoft Learn / Azure docs: azure-monitor/essentials/data-platform-metrics
Exam notes
- Platform metrics need no agent, and standard collection has no direct charge. Budget separately for alert rules, logs, custom metrics, API retrieval, and data export.
- To see in-VM (guest) performance metrics you must install the Azure Monitor Agent + enable diagnostics.
- Metric alerts are the fastest reacting alert type — good for “CPU > 90% for 10 min.”
- Don’t confuse metric alerts (metric signal) with log/log-analytics alerts (KQL query signal) or activity-log alerts.
Related
azure-monitor · metric-alert · log-analytics · workbooks · Home
📘 Source: Microsoft Learn — Metrics in Azure Monitor and Azure Monitor cost and usage, checked 2026-08-22. Re-audit when metrics retention, retrieval, alerting, or pricing behavior changes.
Azure Monitor Activity Log
What it is
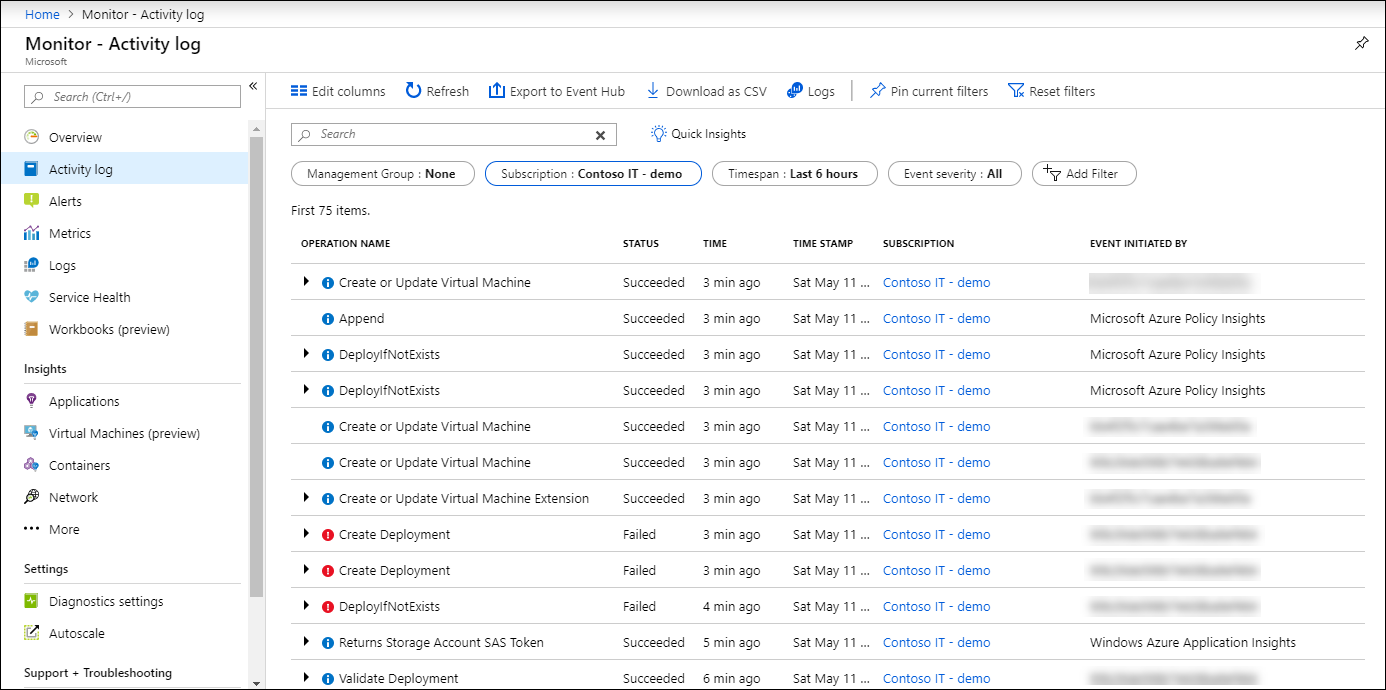
The activity log (formerly audit log) is a subscription-level, control-plane log that records management events — everything that created, modified, or deleted a resource and who did it. It answers “who changed this VM and when?” It covers the management/control plane, not the data inside a VM.
Why it exists
You need auditability and accountability: to know who created a resource, who resized it, who deleted a storage account, and who assigned an RBAC role. The activity log gives a tamper-resistant record of management operations.
Key ideas
- Per-operation entries include: caller identity, which operation ran (e.g.
Microsoft.Compute/virtualMachines/write), resource, timestamp, correlation ID, and the result/status. - Categories/levels: Administrative (write/delete/action), Service Health, Alert, Autoscale, Security (Defender), Resource Health, Policy, Recommendation.
- Retained 90 days by default; for longer, route to a Log Analytics workspace (or storage/event hub).
- Can trigger activity-log alerts and feed action groups (e.g. alert when a VM is deleted).
- View in Azure portal → Monitor → Activity log; query with the activity-log or via KQL once exported.
How it fits (diagram)
Diagrams courtesy of Microsoft Learn / Azure docs: azure-monitor/essentials/activity-log-insights
Exam notes
- Activity log = control plane / management events only — NOT guest OS or app data.
- It is subscription-scoped: one activity log per subscription, all resources.
- 90-day default retention; export to Log Analytics/logging for compliance beyond that.
- Activity-log alerts are a distinct alert type from metric and log alerts.
Related
azure-monitor · log-analytics · metric-alert · action-group · rbac · Home
Log Analytics Workspace
What it is
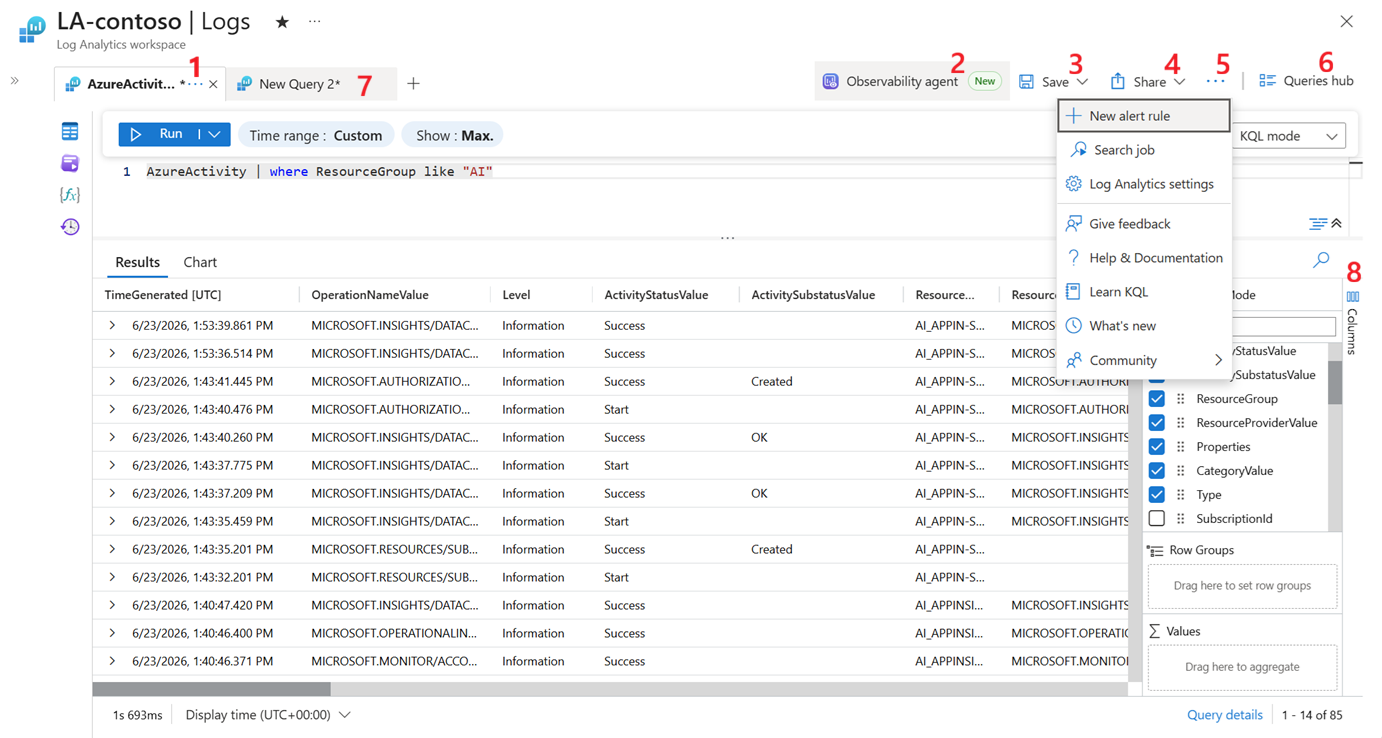
A Log Analytics workspace is an Azure resource that organizes Azure Monitor log data into tables. It is the place teams commonly send, retain, and query diagnostic and application log records. Log Analytics is also the Azure portal tool used to explore that data in simple mode or with KQL.
Why it exists
Metrics answer a quick numeric question such as “what was CPU at 10:00?” Logs preserve richer event detail: an error message, the affected resource, a request ID, or an audit action. A workspace gives those records a shared, queryable home.
Key ideas
- Tables are structured collections of rows. Examples include
AzureActivity,Heartbeat, and resource- or application-specific tables. The tables present depend on what you collect. - Collection must be configured. A diagnostic setting, data collection rule/agent, or integrated service sends eligible data to the workspace. Creating an empty workspace does not make every Azure log appear there.
- Two ways to explore. Simple mode supports point-and-click filtering, sorting, and aggregation. KQL mode lets you write the full query.
- One workspace can receive data from many resources and subscriptions. Opening Logs from a resource scopes the view to that resource; opening from a workspace can access the workspace’s records.
- Logs can drive action. A saved query can support a log search alert or workbook. Retention and cost must be designed for the data you send.
Northwind example
Northwind sends its order API’s diagnostic logs and selected Azure resource logs to one production workspace. When shoppers report failed orders, Maya opens Logs from the API resource to focus on that application’s records, then uses KQL to group failures by time and error code. A workspace query tells her what happened; a metric chart tells her whether request volume or latency changed at the same time.
How it fits (diagram)
Diagrams courtesy of Microsoft Learn / Azure docs: azure-monitor/logs/log-analytics-overview
Exam notes
- A workspace is a log-data scope; Log Analytics is the query experience.
- Data arrives only through an applicable collection configuration or service integration.
- Log alerts run queries; metric alerts evaluate numeric time-series signals.
Related
kql · azure-monitor · azure-monitor-activity-log · workbooks · metric-alert · Home
📘 Source: Microsoft Learn — Log Analytics
Metric Alerts
What it is
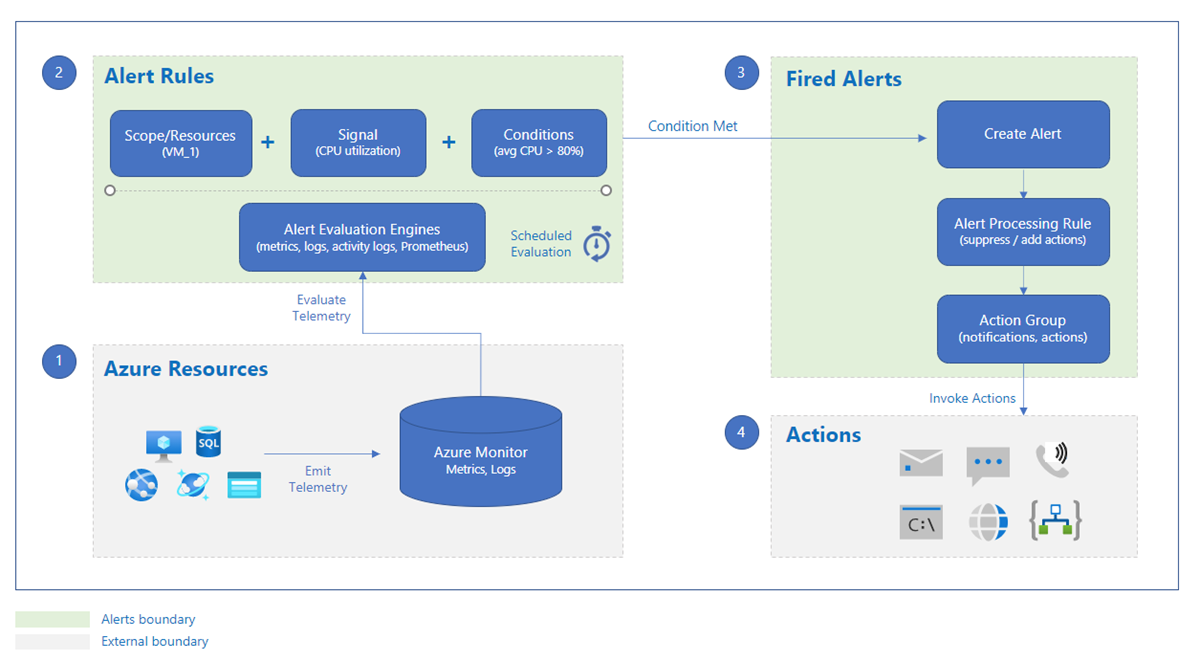
A metric alert is an Azure Monitor alert rule that evaluates a numeric time-series metric at regular intervals. It fires when its configured condition is met—for example, “CPU percentage exceeds 90% for ten minutes”—and can trigger an action group.
Why it exists
Teams cannot watch dashboards constantly. A metric alert detects a chosen numeric symptom and initiates a response. Its useful speed and cost depend on the metric, evaluation frequency, number of monitored time series, and rule design.
Key ideas
- Components: resource(s) to monitor + signal (metric) + condition & threshold + frequency of evaluation + action group + severity.
- Dynamic thresholds can adapt to an observed baseline; static thresholds suit a clearly defined limit. Both require review so normal bursts do not become alert noise.
- State matters. Metric alerts can be stateful or stateless. A stateful metric alert resolves after the condition fails for the documented consecutive checks; an operator acknowledgement is a separate user response.
- Dimensions can separate cases. A rule can evaluate multiple resources or metric dimensions, which can produce distinct alert instances and affect cost.
- Alert processing rules can add or suppress action groups after an alert fires, for example during a planned maintenance window. The alert itself remains visible.
Northwind example
Northwind monitors request latency for each production order API instance. A metric alert evaluates the latency metric every minute and pages the on-call team only after the threshold holds for the selected window. During planned maintenance, a processing rule suppresses the page but the alert remains available for review. The team compares the alert with logs before deciding whether the cause is traffic, a dependency, or a code change.
How it fits (diagram)
Diagrams courtesy of Microsoft Learn / Azure docs: azure-monitor/alerts/alerts-overview
Exam notes
- Know the four alert signals in Azure Monitor: metric, log (KQL), activity log, resource/availability.
- Threshold + frequency + condition are the configurable core; action group is the notification target.
- Severity, monitor condition, and user response are separate concepts.
- Metric alert type fits numeric time series; use a log or activity-log alert when the evidence is a query result or management event.
- Check the metric source before designing the rule; guest OS signals require the relevant collection configuration.
Related
azure-monitor-metrics · action-group · log-analytics · azure-monitor-activity-log · Home
📘 Source: Microsoft Learn — Metric Alert
Action Group
What it is
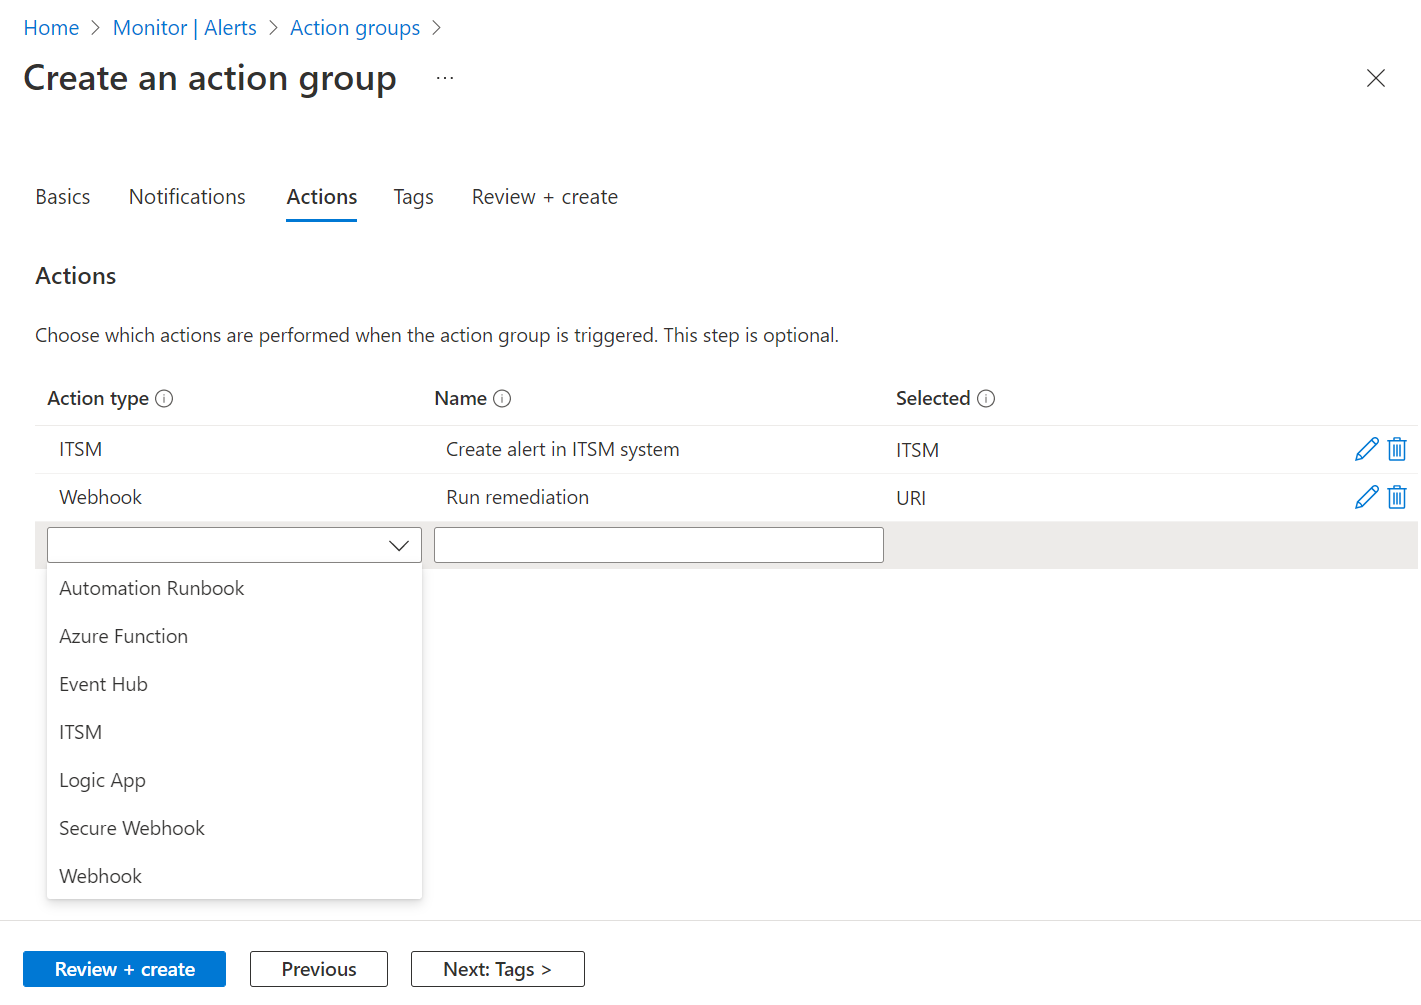
An action group is a named, reusable list of notifications or automated actions that an Azure Monitor alert can invoke. An action group answers “who should hear about this?” or “what approved workflow should begin?” It is separate from the alert rule that decides a problem exists.
Why it exists
An alert without a receiver does nothing. Action groups decouple “detect the problem” (alert rule) from “who gets told / what runs” (action group), so you configure the notification once and reuse it across many alerts. This avoids duplicating email addresses and webhooks on every rule.
Key ideas
- An alert rule can reference one or more action groups, and one action group can be reused by many alerts.
- An action can notify people or invoke an integration such as a webhook, automation runbook, Function, Logic App, or ITSM workflow. Available action types and their validation requirements can change; verify the current documentation for a production design.
- Alert processing rules can suppress or change notifications during planned maintenance or other defined conditions. They do not change the monitored resource or make the underlying alert condition disappear.
Northwind example
Northwind creates an orders-on-call action group with a notification route for the on-call team and a webhook to its incident system. A CPU alert and a checkout-failure alert both reference the same action group. The alert tells the group which condition fired; the action group tells Azure where to send the response. During an announced maintenance window, Northwind uses an alert-processing rule to avoid unnecessary wake-ups while still preserving a clear operational record.
Common confusion
- An action group is not an alert rule, dashboard, or remediation guarantee.
- Sending an email is not the same as fixing an incident. Automated actions need least privilege, idempotency, testing, and a safe failure path.
- Reusing an action group can reduce duplication, but a shared group can also notify the wrong audience if alerts are not classified carefully.
How it fits (diagram)
Diagrams courtesy of Microsoft Learn / Azure docs: azure-monitor/alerts/action-groups
Safe operation
Test notifications and any automated action with a controlled alert. Keep ownership current, avoid putting secrets in alert payloads, and make the alert message useful enough for a responder to begin investigation.
Related
metric-alert · azure-monitor · azure-monitor-activity-log · log-analytics · northwind-traders-case-study
📘 Source: Microsoft Learn — Create and manage action groups, checked 2026-09-16.
Azure Workbooks
What it is
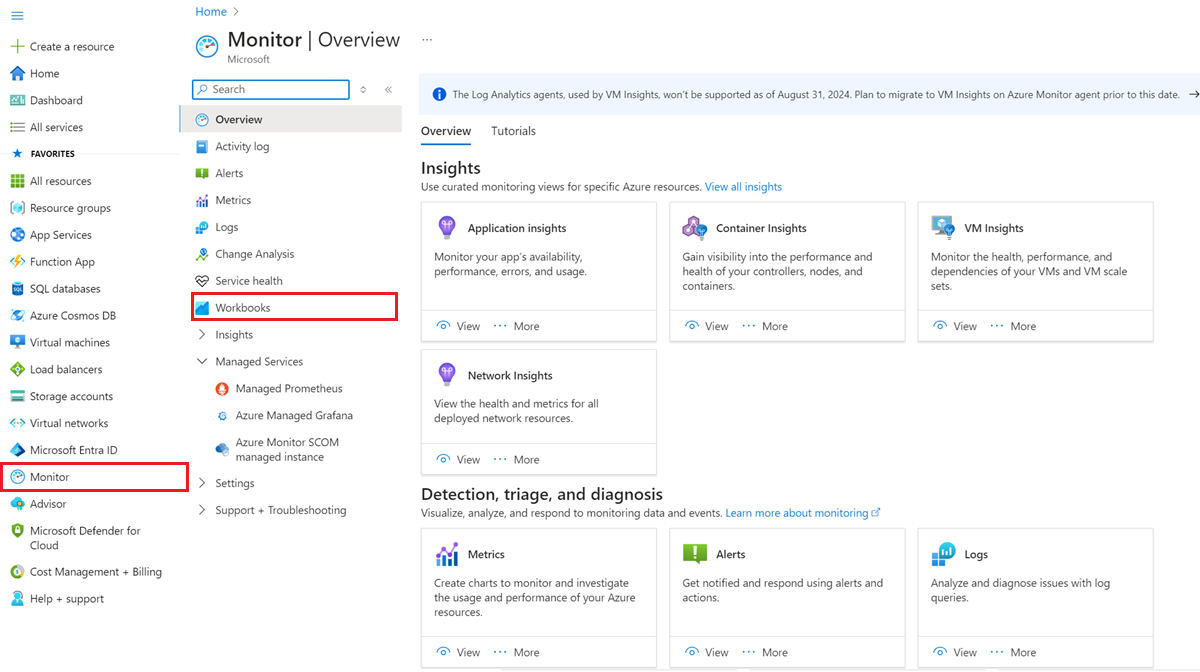
Azure Workbooks are interactive, customizable reports/canvases in Azure Monitor that combine multiple data sources (metrics, Log Analytics KQL queries, activity log, Application Insights) into a single rich document with text, charts, grids, and parameters.
Why it exists
Dashboards show tiles, but incident response needs contextual, parameterized, multi-source views — e.g. “pick an environment then see its VMs, their health, logs, and open alerts together.” Workbooks make that repeatable and shareable, with templates for common scenarios.
Key ideas
- Building blocks: steps combine text, parameters/drop-downs (e.g. select subscription), queries (KQL/metrics), and visualizations (time charts, grids, maps).
- Templates ship for many Azure services (VM, networking, storage) — customize or create from blank.
- Pin workbook parts to dashboards; share across a team/subscription.
- Uses live KQL and metric queries — reusable analysis, not static images.
How it fits (diagram)
Diagrams courtesy of Microsoft Learn / Azure docs: azure-monitor/visualize/workbooks-overview
Exam notes
- Workbooks = interactive multi-source reports; dashboards = pinned tiles. Don’t confuse the two.
- Strongly tied to KQL and Log Analytics for rich queries.
- Templates and parameters are exam-relevant (“create an interactive monitoring report”).
Related
azure-monitor · log-analytics · kql · azure-monitor-metrics · Home
📘 Source: Microsoft Learn — Workbooks
Application Insights
What it is
Application Insights is Azure Monitor’s application-performance-monitoring feature. It collects evidence from inside a running application—requests, dependencies, exceptions, traces, and selected user interactions—so a team can understand what customers experienced rather than only what a server did.
Why it exists
Infrastructure monitoring (CPU, disk) tells you the host is fine but not why users are frustrated. Application Insights instruments the app itself to reveal request latency, error rates, failed dependencies (DBs, external APIs), and end-to-end distributed traces — the insight you need for debugging performance.
Key ideas
- Instrumentation sends application telemetry to Application Insights. For many code-based server applications, Microsoft recommends OpenTelemetry-based collection; the exact setup depends on the runtime.
- A request is work the application receives. A dependency is an external call it makes, such as to storage or a database. An exception records an error. A trace supplies diagnostic context across those operations.
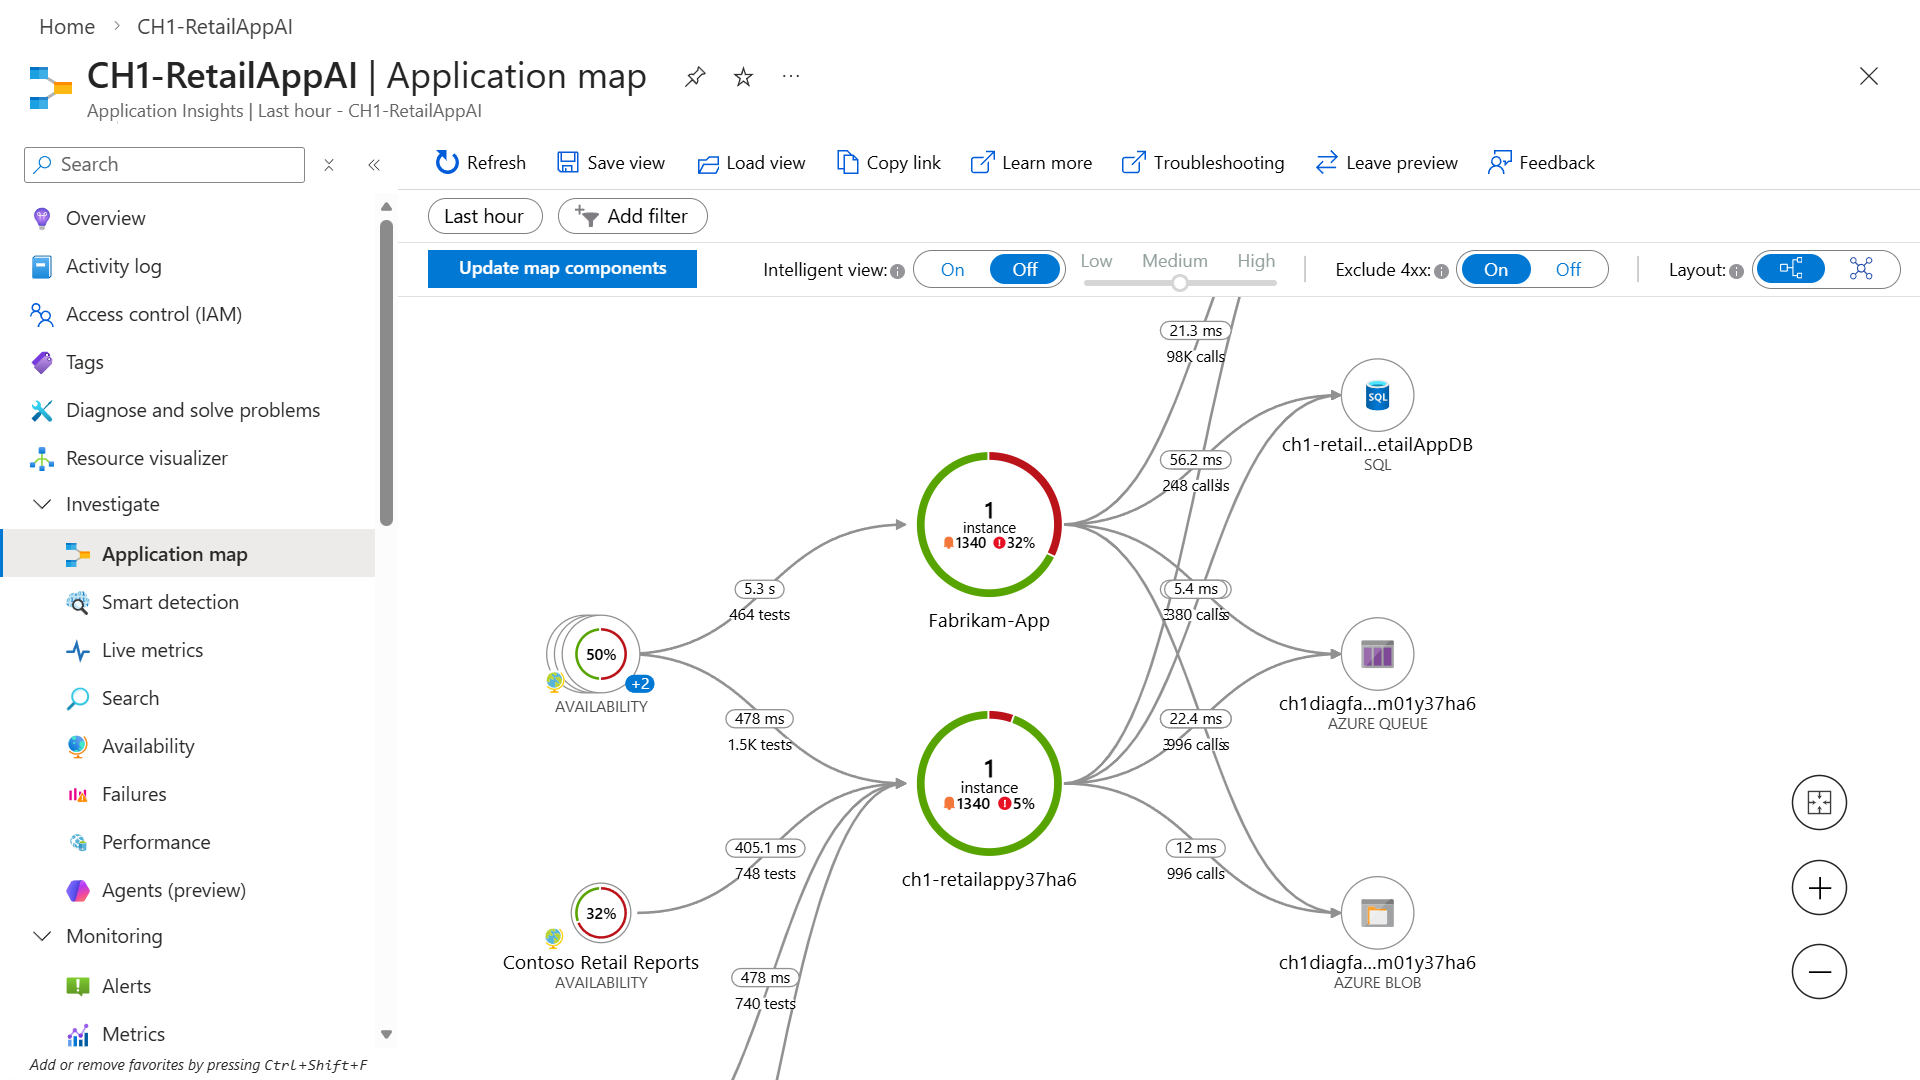
- Application Map and transaction views can show how components call each other. Log Analytics and KQL support deeper analysis where configured.
- Availability tests check an endpoint from outside the application. They are useful evidence of reachability, but do not prove every user journey or dependency works.
Northwind example
When a shopper cannot submit an order, Northwind looks in Application Insights. It can see the failed checkout request, the slow call to Blob Storage, the exception message, and correlated telemetry from the same transaction. A VM CPU metric alone could show that the VM was healthy while customers still saw an application error.
Common confusion
- Application Insights is not a substitute for Azure Monitor infrastructure monitoring; it is part of that wider platform.
- Instrumentation can collect sensitive information if configured carelessly. Choose what to collect, scrub sensitive fields, limit access, and set appropriate retention.
- A successful availability test does not prove a logged-in checkout, payment, or data path is working.
How it fits (diagram)
Diagrams courtesy of Microsoft Learn / Azure docs: azure-monitor/app/app-insights-overview
Where it appears in the route
Read azure-monitor first, then connect this entry to log-analytics, kql, alerts, and an application deployment.
Related
azure-monitor · log-analytics · kql · metric-alert · workbooks · northwind-traders-case-study
📘 Source: Microsoft Learn — Application Insights OpenTelemetry observability, checked 2026-09-16.
Azure Backup
What it is
Azure Backup is Azure’s managed data-protection service. It captures recovery points for supported workloads and lets you restore data, a disk, files, a database, or a fuller workload version when something is deleted, corrupted, or otherwise needs to be recovered. It uses policy-driven schedules and retention rather than asking a person to copy data manually.
Why it exists
Data loss protection for accidental deletion, corruption, or ransomware: you need reliable, retention-controlled, point-in-time copies you can restore on demand. Azure Backup provides managed, encrypted, off-server copies with a simple policy model — instead of scripting your own snapshot jobs.
Key ideas
- A backup policy defines the schedule, frequency, and retention. A recovery point is a recoverable point in time, not an always-running replica.
- Supported workloads and restoration options vary. Azure Backup can protect VMs, disks, databases, Azure Files, blobs, selected container workloads, and supported on-premises workloads, but verify the required workload and target-vault support.
- Azure Backup can use snapshots, vaulted copies, or both, depending on the workload. A snapshot can enable fast restore; a vault copy provides a separate recovery layer and retention.
- Recovery objectives matter: RPO is the amount of recent data the business can lose; RTO is how long recovery may take. A daily backup cannot meet a one-hour data-loss objective.
Northwind example
Northwind backs up the VM hosting a legacy warehouse connector with a policy that matches the acceptable RPO and retention requirement. After a faulty update corrupts the connector, Luis restores a tested recovery point to a safe target and validates it before returning it to service. The backup helps recover the data and VM state; it does not keep a second live application serving customers during a regional outage.
Common confusion
- Site Recovery replicates workloads and orchestrates failover for disaster recovery; Azure Backup protects recoverable copies of data.
- Storage redundancy makes infrastructure copies; backup preserves recovery points. Both can be needed.
- A configured backup is not proof of recovery. Test restores, document owners, and protect the vault from accidental or malicious deletion.
How it fits (diagram)
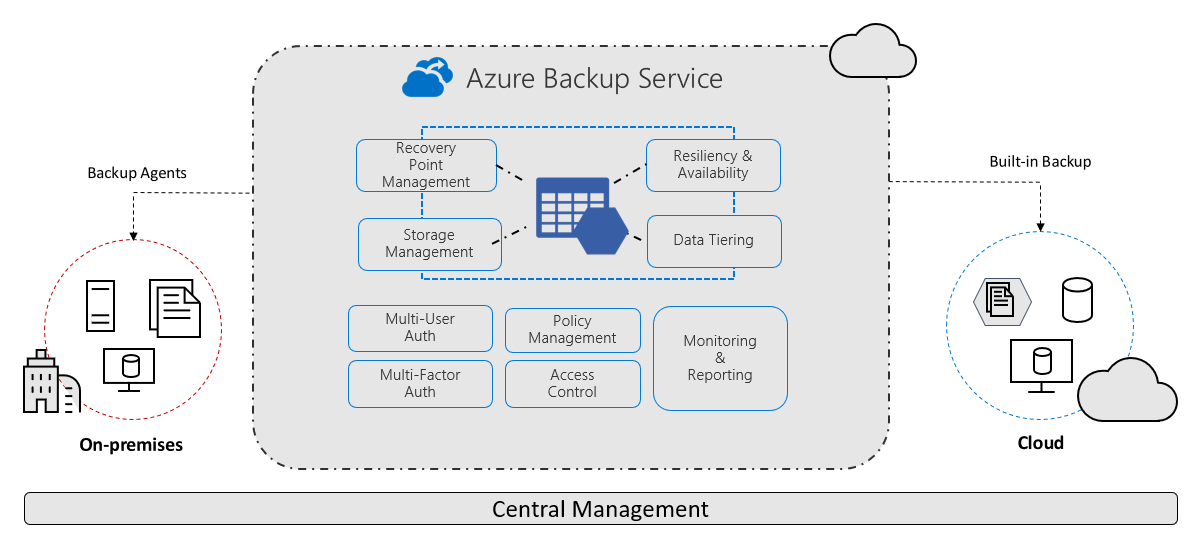
Diagrams courtesy of Microsoft Learn / Azure docs: backup/backup-overview
Plan a restore
Identify the workload, acceptable RPO and RTO, recovery target, policy, retention, vault type, access controls, and test schedule. Monitor backup jobs and investigate failures before an incident makes the gap visible.
Related
recovery-services-vault · backup-vault · azure-backup-policy · azure-site-recovery · azure-vm · redundancy-lrs-zrs-grs · northwind-traders-case-study
📘 Source: Microsoft Learn — What is Azure Backup?, checked 2026-09-16.
Recovery Services Vault
What it is
A Recovery Services vault is an Azure resource that stores protected copies and recovery information for supported Azure Backup workloads, such as Azure VMs and SQL Server in Azure VMs. It is also a central management point for Azure Backup and Site Recovery jobs, alerts, and reporting.
Why it exists
A production VM is not its own recovery plan. A vault is a managed, access-controlled place for recovery points and policies that remains separate from the workload being protected. It helps the team organize protection, but it does not guarantee an application can meet its recovery objectives unless the team designs and tests those objectives.
Key ideas
- Recovery points and policies: the vault stores recovery points created over time and the policies associated with protected workloads.
- Security: backup data is encrypted with platform-managed keys by default. Customer-managed keys are available for supported designs but must be configured before protecting items in the vault.
- Soft delete: deleted backup data is retained for a protection period; enhanced soft delete can be configured for stronger retention. It is a recovery safeguard, not a replacement for monitoring or access control.
- Redundancy and recovery: choose supported vault storage redundancy and recovery features intentionally. Geographic recovery behavior and feature availability differ by workload and vault configuration.
- Scope: the vault is an Azure resource subject to RBAC. A separate backup policy defines scheduled protection for applicable workloads.
Northwind example
Northwind backs up a production VM to a Recovery Services vault. Maya chooses the policy, Priya watches job results, and the team practices restoring a copy into a safe target. A malicious or mistaken deletion of backup data may be recoverable through soft delete, but a lock on the vault alone does not protect every data-plane operation and does not prove the restored application will work.
How it fits (diagram)
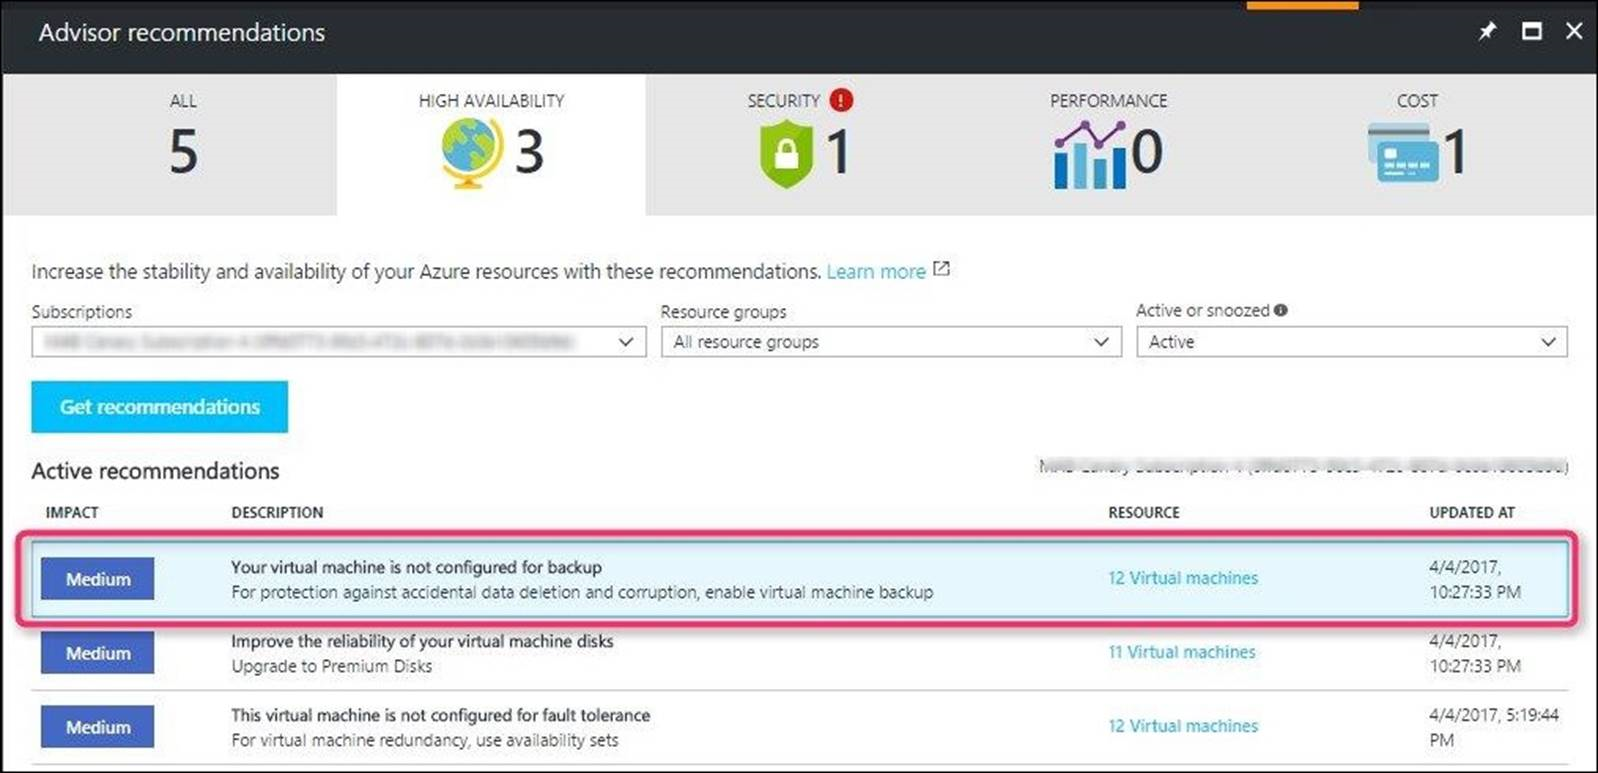
Diagrams courtesy of Microsoft Learn / Azure docs: backup/backup-azure-recovery-services-vault-overview
Exam notes
- Recovery Services vaults and Backup vaults serve different supported workload sets.
- Customer-managed-key encryption must be planned before the first protected item when that requirement applies.
- Soft delete affects how backup removal and recovery behave; include it in decommissioning procedures.
Related
azure-backup · azure-backup-policy · azure-site-recovery · azure-vm · Home
📘 Source: Microsoft Learn — Recovery Services vaults overview
Azure Backup Policy
What it is
A backup policy is the reusable rule that says when Azure Backup takes recovery points (schedule) and how long it keeps them (retention). The supported policy model depends on the workload and vault type.
Why it exists
Teams need protection to happen predictably instead of relying on someone remembering a manual backup. A policy encodes a requirement such as “back up daily; retain selected daily, weekly, monthly, and yearly recovery points.” Retention affects both recovery options and storage cost.
Key ideas
- Schedule: how often Azure Backup creates recovery points. Capabilities differ across workload types; do not assume every workload supports the same frequency.
- Retention: how long selected recovery points remain available. A policy can preserve daily, weekly, monthly, or yearly points where supported.
- Assignment: one policy can protect multiple compatible resources. A VM backup policy, for example, can protect multiple Azure VMs.
- Change management: changing a policy can change future protection and retention behavior. Understand the existing recovery points and the workload-specific effect before editing a production policy.
- Recovery targets: schedule and retention alone do not define recovery time. Test how long a real restore takes and whether the restored application is usable.
Northwind example
Northwind gives its ordering VMs a policy that takes scheduled backups and keeps a longer monthly recovery point for its audit needs. Before accepting the policy, Priya asks two separate questions: “How much history can we recover?” (retention) and “How quickly can we return the service?” (restore testing and recovery time). A daily backup schedule does not promise a one-hour restoration.
How it fits (diagram)
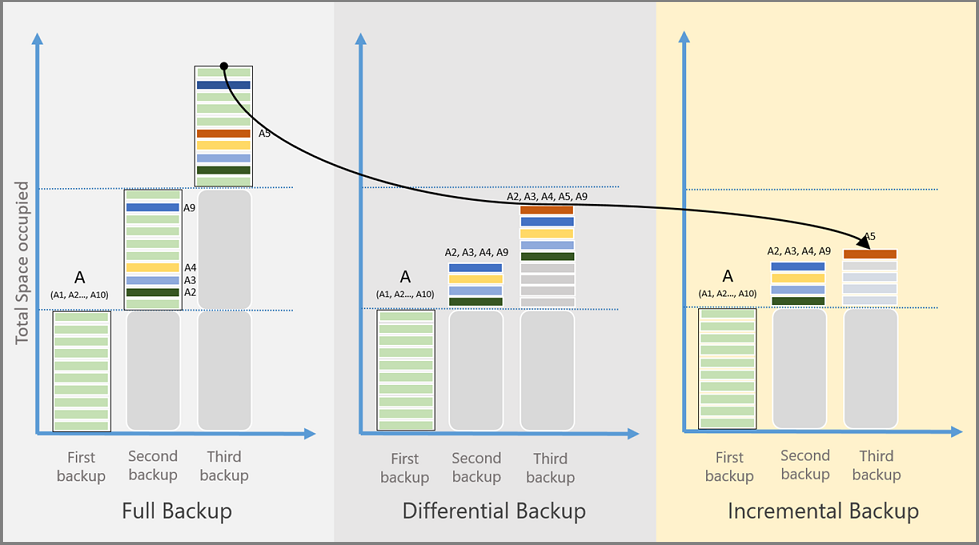
Diagrams courtesy of Microsoft Learn / Azure docs: backup/backup-architecture
Exam notes
- Policy = schedule + retention, applied to compatible protected resources through the supported vault model.
- A policy is only intent until jobs succeed and a restore has been tested.
Related
azure-backup · recovery-services-vault · azure-vm · Home
📘 Source: Microsoft Learn — Azure Backup architecture and components